Headers slightly changed in pcp-dstat output, and the chart we need to
get is called "total usage:idl".  Look for this field, or fall back to
the old one to support both output formats.

Change-Id: Ib9aaf3c18da63cf5acd44ccf6eaff1c5fa68ac12
dstat_graph
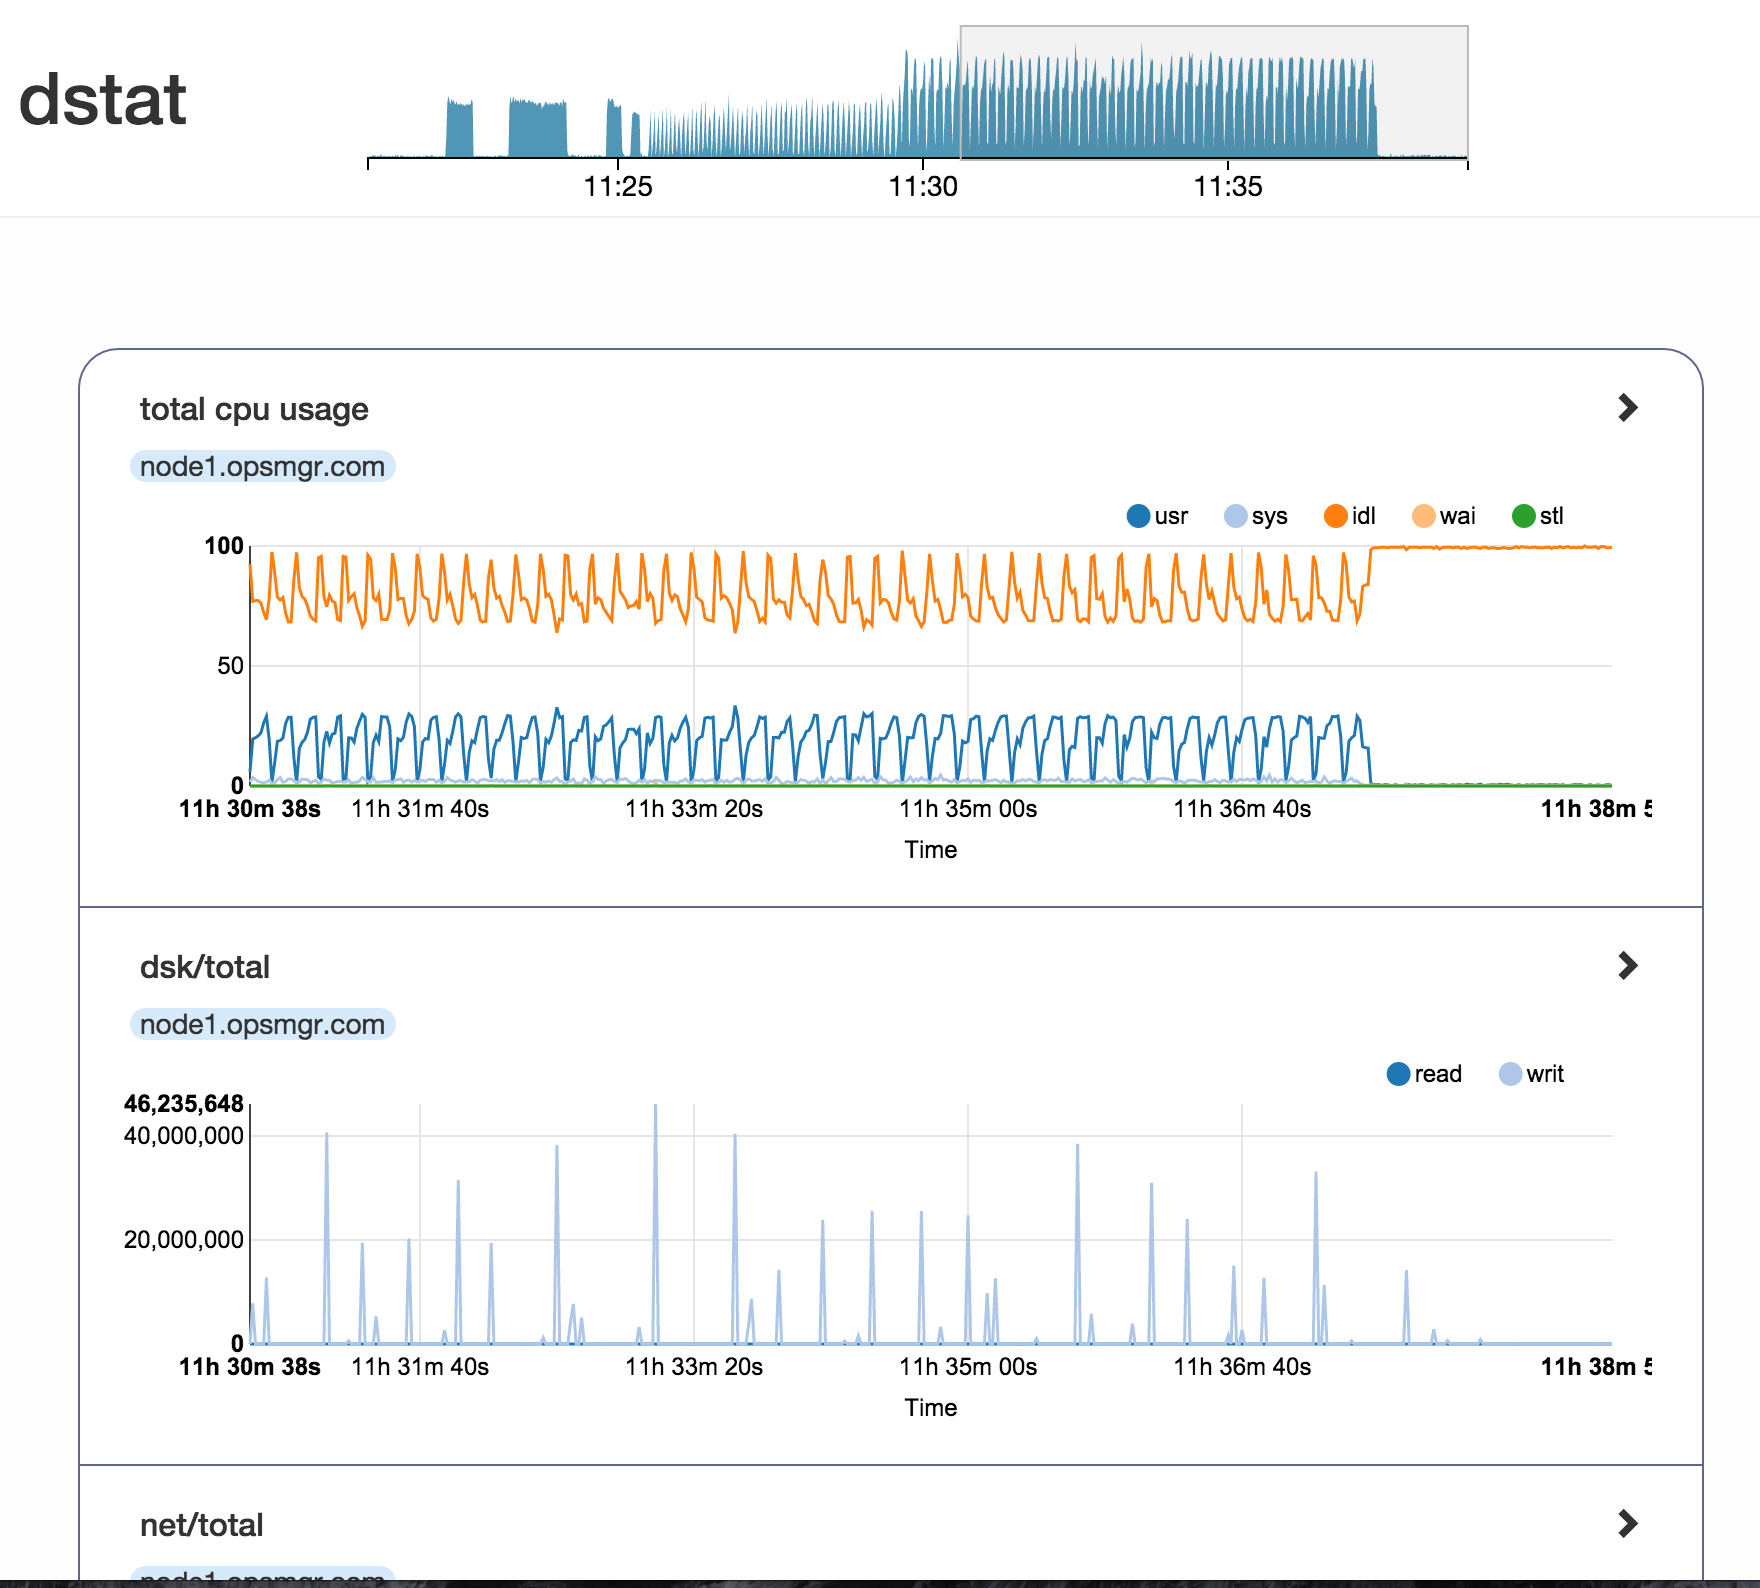
Graph on top of dstat, because we love UI <3
dstat graph is a light standalone javascript application that nicely format and display the output of dstat (https://github.com/gianpaj/dstat).