1. Fix the image display issue on GitHub;
2. Add the installation of git-review on RHEL;

Change-Id: Ieaf3b8066284c2d2daf37b0a1d898bc241c82a7f
Overview
VMTP is a data path performance measurement tool for OpenStack clouds.
Features
Have you ever had the need for a quick, simple and automatable way to get VM-level or host-level single-flow throughput and latency numbers from any OpenStack cloud, and take into account various Neutron topologies? Or check whether some OpenStack configuration option, Neutron plug-in performs to expectation or if there is any data path impact for upgrading to a different OpenStack release?
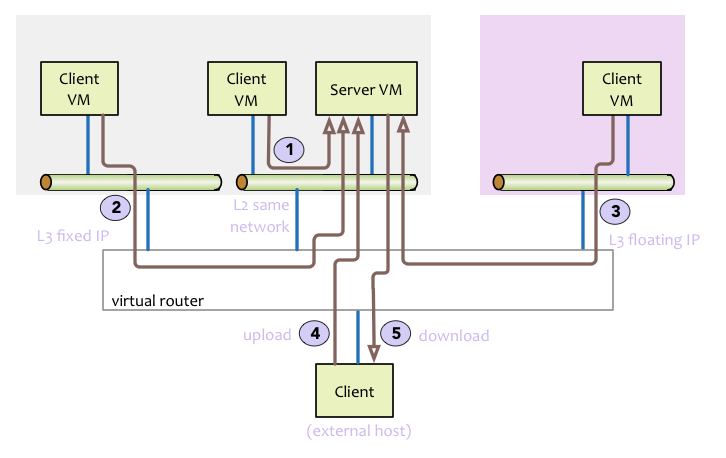
VMTP is a small python application that will automatically perform ping connectivity, round trip time measurement (latency) and TCP/UDP throughput measurement for the following East/West flows on any OpenStack deployment:
- VM to VM same network (private fixed IP, flow #1)
- VM to VM different network using fixed IP (same as intra-tenant L3 fixed IP, flow #2)
- VM to VM different network using floating IP and NAT (same as floating IP inter-tenant L3, flow #3)
Optionally, when an external Linux host is available for testing North/South flows:
- External host/VM download and upload throughput/latency (L3/floating IP, flow #4 and #5)
Optionally, when SSH login to any Linux host (native or virtual) is available:
- Host to host process-level throughput/latency (intra-node and inter-node)
Optionally, VMTP can extract automatically CPU usage from all native hosts in the cloud during the throughput tests, provided the Ganglia monitoring service (gmond) is installed and enabled on those hosts.
For VM-related flows, VMTP will automatically create the necessary OpenStack resources (router, networks, subnets, key pairs, security groups, test VMs) using the public OpenStack API, install the test tools then orchestrate them to gather the throughput measurements then cleanup all related resources before exiting.
See the usage page for the description of all the command line arguments supported by VMTP.
Pre-requisite
VMTP runs on any Python 2.X envirnment (validated on Linux and MacOSX).
For VM related performance measurements
- Access to the cloud Horizon Dashboard (to retrieve the openrc file)
- 1 working external network pre-configured on the cloud (VMTP will pick the first one found)
- At least 2 floating IP if an external router is configured or 3 floating IP if there is no external router configured
- 1 Linux image available in OpenStack (any distribution)
- A configuration file that is properly set for the cloud to test (see "Configuration File" section below)
For native/external host throughputs
- A public key must be installed on the target hosts (see ssh password-less access below)
For pre-existing native host throughputs
- Firewalls must be configured to allow TCP/UDP ports 5001 and TCP port 5002
Sample Results Output
VMTP will display the results to stdout with the following data:
- Session general information (date, auth_url, OpenStack encaps, VMTP version, OpenStack release, Agent type, CPU...)
- List of results per flow, for each flow:
|   flow name
|   to and from IP addresses
|   to and from availability zones (if VM)
|   - results:
|   |   -TCP
|   |   |  packet size
|   |   |  throughput value
|   |   |  number of retransmissions
|   |   |  round trip time in ms
|   |   |  - CPU usage (if enabled), for each host in the openstack cluster
|   |   |  | baseline (before test starts)
|   |   |  | 1 or more readings during test
|   |   -UDP
|   |   |  - for each packet size
|   |   |  | throughput value
|   |   |  | loss rate
|   |   |  | CPU usage (if enabled)
|   |   - ICMP
|   |   |  average, min, max and stddev round trip time in ms
Detailed results can also be stored in a file in JSON format using the --json command line argument and/or stored directly into a MongoDB server. See example.json for an example JSON file that is generated by VMTP.
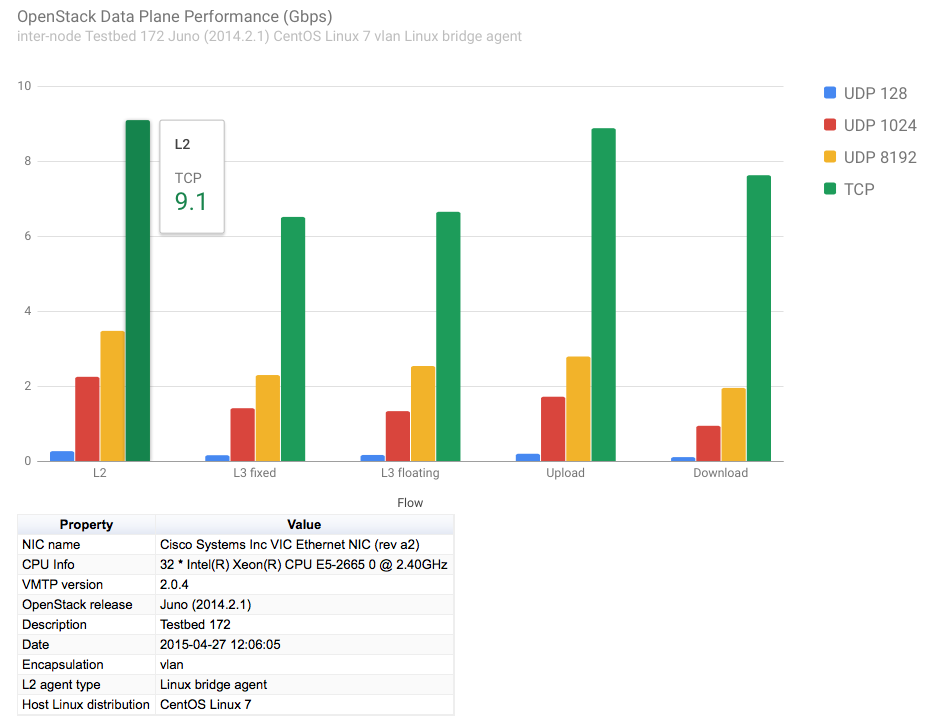
The packaged python tool genchart.py can be used to generate from the JSON result files column charts in HTML format visible from any browser.
Example of column chart generated by genchart.py:
Limitations and Caveats
VMTP only measures performance for single-flows at the socket/TCP/UDP level (in a VM or natively). Measured numbers therefore reflect what most applications will see.
It is not designed to measure driver level data path performance from inside a VM (such as bypassing the kernel TCP stack and write directly to virtio), there are better tools that can address this type of mesurement.
Licensing
VMTP is licensed under Apache License 2.0 and comes packaged with the following tools for convenience:
- iperf: BSD License (https://iperf.fr/license.html, source code: https://iperf.fr)
- nuttcp: GPL v2 License (http://nuttcp.net/nuttcp/beta/LICENSE, source code: http://nuttcp.net/nuttcp/beta/nuttcp-7.3.2.c)
Redistribution of nuttcp and iperf is governed by their respective licenses. Please make sure you read and understand each one before further redistributing VMTP downstream.
Links
- Documentation: http://vmtp.readthedocs.org/en/latest
- Source: http://git.openstack.org/cgit/stackforge/vmtp
- Supports/Bugs: https://launchpad.net/vmtp
- Mailing List: vmtp-core@lists.launchpad.net

