19 KiB
System Architecture
High Level Description
single: agent; architecture double: compute agent; architecture double: collector; architecture double: data store; architecture double: database; architecture double: API; architecture
Objectives
The Ceilometer project was started in 2012 with one simple goal in mind: to provide an infrastructure to collect any information needed regarding OpenStack projects. It was designed so that rating engines could use this single source to transform events into billable items which we label as "metering".
As the project started to come to life, collecting an increasing number of metrics across multiple projects, the OpenStack community started to realize that a secondary goal could be added to Ceilometer: become a standard way to collect metric, regardless of the purpose of the collection. For example, Ceilometer can now publish information for monitoring, debugging and graphing tools in addition or in parallel to the metering backend. We labelled this effort as “multi-publisher“.
Most recently, as the Heat project started to come to life, it soon became clear that the OpenStack project needed a tool to watch for variations in key values in order to trigger various reactions. As Ceilometer already had the tooling to collect vast quantities of data, it seemed logical to add this as an extension of the Ceilometer project, which we tagged as “alarming“.
Metering
If you divide a billing process into a 3 step process as is commonly done in the telco industry, the steps are:
Meteringis the process of collecting information about what, who, when and how much regarding anything that can be billed. The result of this is a collection of “tickets” (a.k.a. samples) which are ready to be processed in anyway you want.Ratingis the process of analysing a series of tickets, according to business rules defined by marketing, in order to transform them into bill line items with a currency value.Billingis the process to assemble bill line items into a single per customer bill, emitting the bill to start the payment collection.
Ceilometer’s initial goal was, and still is, strictly limited to step one. This is a choice made from the beginning not to go into rating or billing, as the variety of possibilities seemed too huge for the project to ever deliver a solution that would fit everyone’s needs, from private to public clouds. This means that if you are looking at this project to solve your billing needs, this is the right way to go, but certainly not the end of the road for you. Once Ceilometer is in place on your OpenStack deployment, you will still have quite a few things to do before you can produce a bill for your customers. One of you first task could be: finding the right queries within the Ceilometer API to extract the information you need for your very own rating engine.
You can of course use the same API to satisfy other needs, such as a data mining solution to help you identify unexpected or new usage types, or a capacity planning solution. In general, it is recommended to download the data from the API in order to work on it in a separate database to avoid overloading the one which should be dedicated to storing tickets. It is also often found that the Ceilometer metering DB only keeps a couple months worth of data while data is regularly offloaded into a long term store connected to the billing system, but this is fully left up to the implementor.
Note
We do not guarantee that we won’t change the DB schema, so it is highly recommended to access the database through the API and not use direct queries.
How is data collected?
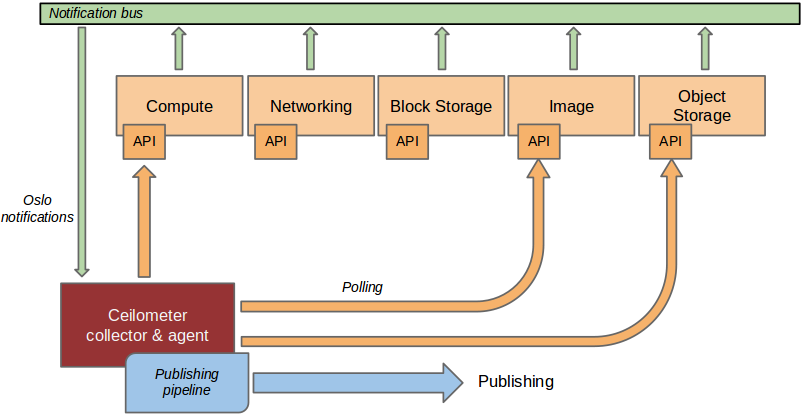
In a perfect world, each and every project that you want to instrument should send events on the Oslo bus about anything that could be of interest to your. Unfortunately, not all projects have implemented this and you will often need to instrument other tools which may not use the same bus as OpenStack has defined. To circumvent this, the Ceilometer project created 3 independent methods to collect data:
Bus listener agentwhich takes events generated on the Oslo notification bus and transforms them into Ceilometer sample. Again this is the preferred method of data collection. If you are working on some OpenStack related project and are using the Oslo library, you are kindly invited to come and talk to one of the project members to learn how you could quickly add instrumentation for your project.Push agentswhich is the only solution to fetch data within projects which do not expose the required data in a remotely useable way. This is not the preferred method as it makes deployment a bit more complex having to add a component to each of the nodes that need to be monitored. However, we do prefer this compared to a polling agent method as resilience (high availability) will not be a problem with this method.Polling agentswhich is the least preferred method, that will poll some API or other tool to collect information at a regular interval. The main reason why we do not like this method is the inherent difficulty to make such a component be resilient.
The first method is supported by the ceilometer-collector agent, which monitors the message queues for notifications and for metering data coming from the "push" and "polling" agents. Methods 2 and 3 rely on a combination of the ceilometer-central-agent/ceilometer-compute-agent and the collector.
How to access collected data?
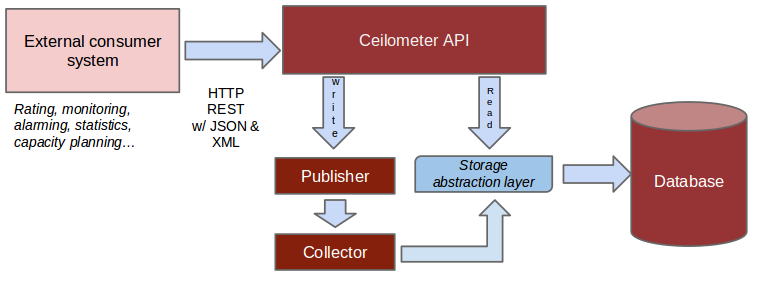
Once collected, the data is stored in a database generally, or in a
simple file if you do not care about API access and want to do the rest
of the processing elsewhere. There can be multiple types of databases
through the use of different database plugins (see the section which-db). Moreover, the
schema and dictionary of this database can also evolve over time. For
both reasons, we offer a REST API that should be the only way for you to
access the collected data rather than accessing the underlying database
directly. It is possible that the way you’d like to access your data is
not yet supported by the API. If you think this is the case, please
contact us with your feedback as this will certainly lead us to improve
the API.
The list of currently built in meters <measurements>
is available in the developer documentation, and it is also relatively
easy to add your own (and eventually contribute it).
Ceilometer is part of OpenStack, but is not tied to OpenStack's definition of "users" and "tenants." The "source" field of each sample refers to the authority defining the user and tenant associated with the sample. Deployers can define custom sources through a configuration file, and then create agents to collect samples for new meters using those sources. This means that you can collect data for applications running on top of OpenStack, such as a PaaS or SaaS layer, and use the same tools for metering your entire cloud.
Moreover, end users can also send their own application centric data <user-defined-data>
into the database through the REST API for a various set of use cases
(see the section “Alarming” later in this article).
Multi-Publisher
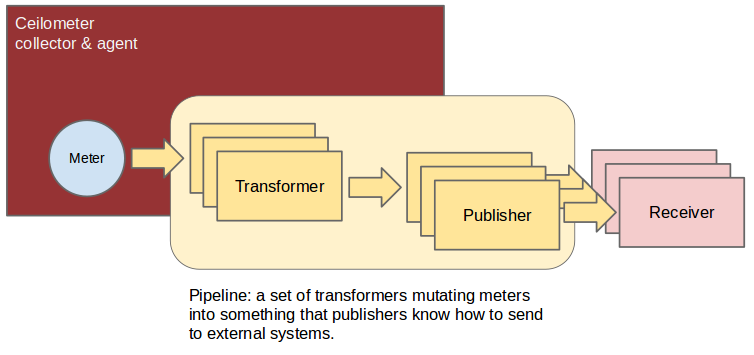
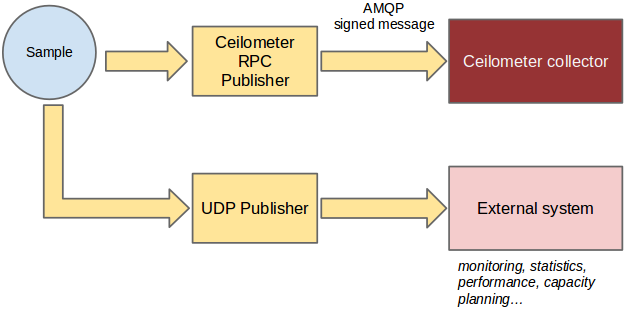
Publishing meters for different uses is actually a two dimensional problem. The first variable is the frequency of publication. Typically a meter that you publish for billing need will need to be updated every 30 min while the same meter needed for performance tuning may be needed every 10 seconds.
The second variable is the transport. In the case of data intended for a monitoring system, losing an update or not ensuring security (non-repudiability) of a message is not really a problem while the same meter will need both security and guaranteed delivery in the case of data intended for rating and billing systems.
To solve this, the notion of multi-publisher can now be configured for each meter within Ceilometer, allowing the same technical meter to be published multiple times to multiple destination each potentially using a different transport and frequency of publication. At the time of writing, two transports have been implemented so far: the original and relatively secure Oslo RPC queue based, and one using UDP packets.
Alarming
The Alarming component of Ceilometer, which is being delivered in the
Havana version, allows you to set alarms based on threshold evaluation
for a collection of samples. An alarm can be set on a single meter, or
on a combination. For example, you may want to trigger an alarm when the
memory consumption reaches 70% on a given instance if the instance has
been up for more than 10 min. To setup an alarm, you will call Ceilometer’s API server <alarms-api> specifying
the alarm conditions and an action to take.
Of course, if you are not administrator of the cloud itself, you can
only set alarms on meters for your own components. Good news, you can
also send your own meters <user-defined-data> from
within your instances, meaning that you can trigger alarms based on
application centric data.
There can be multiple form of actions, but two have been implemented so far:
HTTP callback: you provide a URL to be called whenever the alarm has been set off. The payload of the request contains all the details of why the alarm went off.log: mostly useful for debugging, stores alarms in a log file.
For more details on this, I recommend you to read the blog post by Mehdi Abaakouk Autoscaling with Heat and Ceilometer. Particular attention should be given to the section “Some notes about deploying alarming” as the database setup (using a separate database from the one used for metering) will be critical in all cases of production deployment.
Which database to use
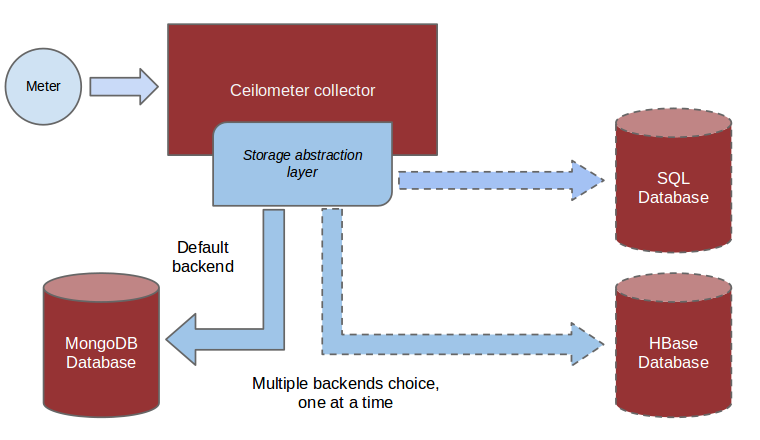
Since the beginning of the project, a plugin model has been put in place to allow for various types of database backends to be used. However, not all implementations are equal and, at the time of writing, MongoDB is the recommended backend of choice because it is the most tested. Have a look at the “choosing a database backend” section of the documentation for more details. In short, ensure a dedicated database is used when deploying Ceilometer as the volume of data generated can be extensive in a production environment and will generally use a lot of I/O.
Detailed Description
Warning
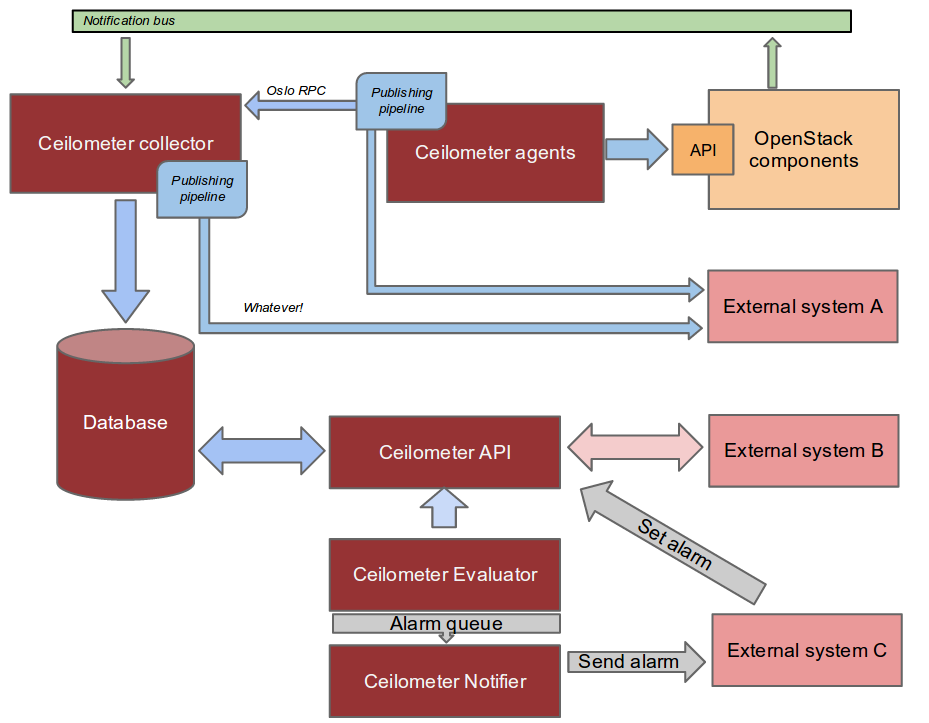
These details cover only the compute agent and collector, as well as their communication via the messaging bus. More work is needed before the data store and API server designs can be documented.
Plugins
double: plugins; architecture single: plugins; setuptools single: plugins; entry points
Although we have described a list of the metrics ceilometer should collect, we cannot predict all of the ways deployers will want to measure the resources their customers use. This means that ceilometer needs to be easy to extend and configure so it can be tuned for each installation. A plugin system based on setuptools entry points makes it easy to add new monitors in the collector or subagents for polling.
Each daemon provides basic essential services in a framework to be shared by the plugins, and the plugins do the specialized work. As a general rule, the plugins are asked to do as little work as possible. This makes them more efficient as greenlets, maximizes code reuse, and makes them simpler to implement.
Installing a plugin automatically activates it the next time the ceilometer daemon starts. A global configuration option can be used to disable installed plugins (for example, one or more of the "default" set of plugins provided as part of the ceilometer package).
Plugins may require configuration options, so when the plugin is loaded it is asked to add options to the global flags object, and the results are made available to the plugin before it is asked to do any work.
Rather than running and reporting errors or simply consuming cycles for no-ops, plugins may disable themselves at runtime based on configuration settings defined by other components (for example, the plugin for polling libvirt does not run if it sees that the system is configured using some other virtualization tool). The plugin is asked once at startup, after it has been loaded and given the configuration settings, if it should be enabled. Plugins should not define their own flags for enabling or disabling themselves.
Warning
Plugin self-deactivation is not implemented, yet.
Each plugin API is defined by the namespace and an abstract base class for the plugin instances. Plugins are not required to subclass from the API definition class, but it is encouraged as a way to discover API changes.
Polling
double: polling; architecture
Metering data comes from two sources: through notifications built
into the existing OpenStack components and by polling the infrastructure
(such as via libvirt). Polling for compute resources is handled by an
agent running on the compute node (where communication with the
hypervisor is more efficient). The compute agent daemon is configured to
run one or more pollster plugins using the
ceilometer.poll.compute namespace. Polling for resources
not tied to the compute node is handled by the central agent. The
central agent daemon is configured to run one or more pollster
plugins using the ceilometer.poll.central namespace.
The agents periodically asks each pollster for instances of
Counter objects. The agent framework converts the Counters
to metering messages, which it then signs and transmits on the metering
message bus.
The pollster plugins do not communicate with the message bus directly, unless it is necessary to do so in order to collect the information for which they are polling.
All polling happens with the same frequency, controlled by a global setting for the agent.
Handling Notifications
double: notifications; architecture
The heart of the system are the notification daemon (agent-notification) and the collector, which monitor the message bus for data being provided by the pollsters via the agent as well as notification messages from other OpenStack components such as nova, glance, neutron, and swift.
The notification daemon loads one or more listener plugins,
using the namespace ceilometer.notification. Each plugin
can listen to any topics, but by default it will listen to
notifications.info.
The plugin provides a method to list the event types it wants and a
callback for processing incoming messages. The registered name of the
callback is used to enable or disable it using the pipeline of the
notification daemon. The incoming messages are filtered based on their
event type value before being passed to the callback so the plugin only
receives events it has expressed an interest in seeing. For example, a
callback asking for compute.instance.create.end events
under ceilometer.collector.compute would be invoked for
those notification events on the nova exchange using the
notifications.info topic.
The listener plugin returns an iterable with zero or more Sample instances based on the data in the incoming message. The collector framework code converts the Sample instances to metering messages and publishes them on the metering message bus. Although Ceilometer includes a default storage solution to work with the API service, by republishing on the metering message bus we can support installations that want to handle their own data storage.
The Ceilometer collector daemon then receives this Sample on the bus and stores them into a database.
Handling Metering Messages
The listener for metering messages also runs in the collector daemon. It validates the incoming data and (if the signature is valid) then writes the messages to the data store.
Note
Because this listener uses openstack.common.rpc instead
of notifications, it is implemented directly in the collector code
instead of as a plugin.
Metering messages are signed using the hmac module in Python's standard library. A shared secret value can be provided in the ceilometer configuration settings. The messages are signed by feeding the message key names and values into the signature generator in sorted order. Non-string values are converted to unicode and then encoded as UTF-8. The message signature is included in the message for verification by the collector, and stored in the database for future verification by consumers who access the data via the API.
RPC
Ceilomter uses openstack.common.rpc to cast messages
from the agent to the collector.
- http://wiki.openstack.org/EfficientMetering/ArchitectureProposalV1
- http://wiki.openstack.org/EfficientMetering#Architecture
- Bug 1010037 : allow different polling interval for each pollster