During getting through the "System Architecture" documentation I've hit
some cosmetic issues which would be nice to have in our codebase.

Change-Id: I55179d91c95e215f7b4b05b9a19245faa42f0661
12 KiB
System Architecture
single: agent; architecture double: compute agent; architecture double: collector; architecture double: data store; architecture double: database; architecture double: API; architecture
High-Level Architecture
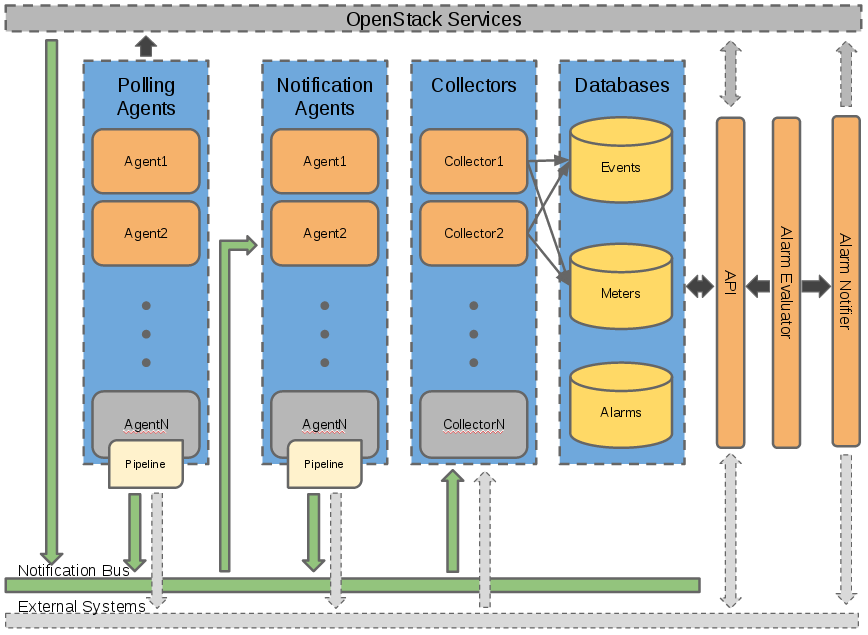
Each of Ceilometer's services are designed to scale horizontally. Additional workers and nodes can be added depending on the expected load. Ceilometer offers five core services, the data agents designed to work independently from collection and alarming, but also designed to work together as a complete solution:
- polling agent - daemon designed to poll OpenStack services and build Meters.
- notification agent - daemon designed to listen to notifications on message queue and convert them to Events and Samples.
- collector - daemon designed to gather and record event and metering data created by notification and polling agents.
- api - service to query and view data recorded by collector service.
- alarming - daemons to evaluate and notify based on defined alarming rules.
Gathering the data
How is data collected?
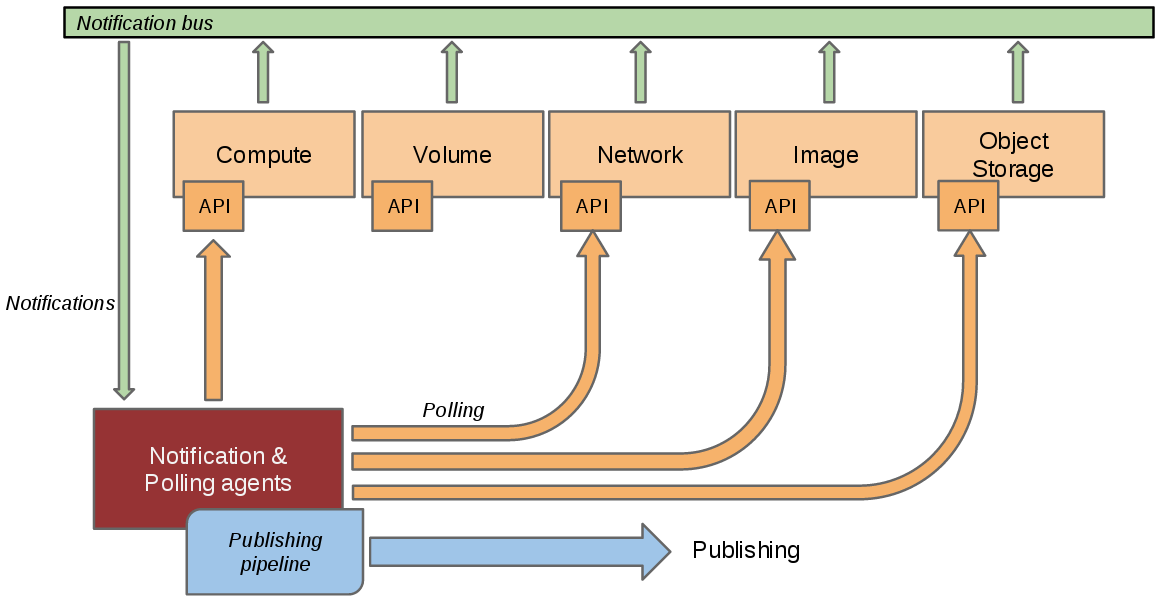
In a perfect world, each and every project that you want to instrument should send events on the Oslo bus about anything that could be of interest to you. Unfortunately, not all projects have implemented this and you will often need to instrument other tools which may not use the same bus as OpenStack has defined. The Ceilometer project created 2 methods to collect data:
Bus listener agentwhich takes events generated on the notification bus and transforms them into Ceilometer samples. This is the preferred method of data collection. If you are working on some OpenStack related project and are using the Oslo library, you are kindly invited to come and talk to one of the project members to learn how you could quickly add instrumentation for your project.Polling agents, which is the less preferred method, will poll some API or other tool to collect information at a regular interval. Where the option exists to gather the same data by consuming notifications, then the polling approach is less preferred due to the load it can impose on the API services.
The first method is supported by the ceilometer-notification agent, which monitors the message queues for notifications. Polling agents can be configured either to poll local hypervisor or remote APIs (public REST APIs exposed by services and host-level SNMP/IPMI daemons).
Notification Agents: Listening for data
double: notifications; architecture
The heart of the system is the notification daemon (agent-notification) which monitors the message bus for data being provided by other OpenStack components such as Nova, Glance, Cinder, Neutron, Swift, Keystone, and Heat.
The notification daemon loads one or more listener plugins,
using the namespace ceilometer.notification. Each plugin
can listen to any topics, but by default it will listen to
notifications.info. The listeners grab messages off the
defined topics and redistributes them to the appropriate
plugins(endpoints) to be processed into Events and Samples.
Sample-oriented plugins provide a method to list the event types
they're interested in and a callback for processing messages
accordingly. The registered name of the callback is used to enable or
disable it using the pipeline of the notification daemon. The incoming
messages are filtered based on their event type value before being
passed to the callback so the plugin only receives events it has
expressed an interest in seeing. For example, a callback asking for
compute.instance.create.end events under
ceilometer.compute.notifications would be invoked for those
notification events on the nova exchange using the
notifications.info topic. Event matching can also work
using wildcards e.g. compute.instance.*.
Similarly, if enabled, notifications are converted into Events which can be filtered based on event_type declared by other services.
Polling Agents: Asking for data
double: polling; architecture
Polling for compute resources is handled by a polling agent running
on the compute node (where communication with the hypervisor is more
efficient), often referred to as the compute-agent. Polling via service
APIs for non-compute resources is handled by an agent running on a cloud
controller node, often referred to the central-agent. A single agent can
fulfill both roles in an all-in-one deployment. Conversely, multiple
instances of an agent may be deployed, in which case the workload is
shared. The polling agent daemon is configured to run one or more
pollster plugins using either the
ceilometer.poll.compute and/or
ceilometer.poll.central namespaces.
The agents periodically ask each pollster for instances of
Sample objects. The frequency of polling is controlled via
the pipeline configuration. See Pipeline-Configuration for details. The agent
framework then passes the samples to the pipeline for processing.
Please notice that there's an optional config called
shuffle_time_before_polling_task in ceilometer.conf. Enable
this by setting an integer greater than zero to shuffle agents to start
polling task, so as to add some random jitter to the time of sending
requests to nova or other components to avoid large number of requests
in short time.
Processing the data
Pipeline Manager
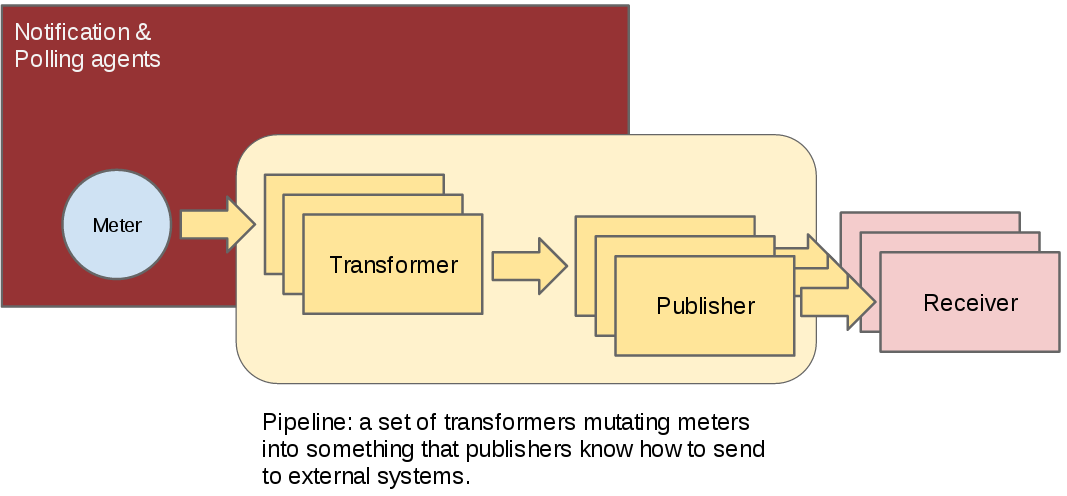
Ceilometer offers the ability to take data gathered by the agents, manipulate it, and publish it in various combinations via multiple pipelines.
Transforming the data
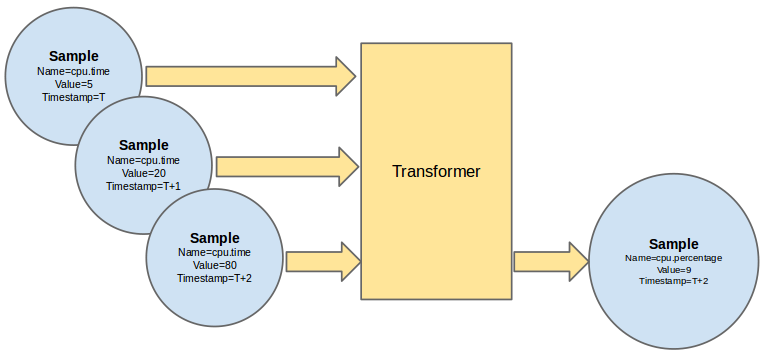
The data gathered from the polling and notifications agents contains a wealth of data and if combined with historical or temporal context, can be used to derive even more data. Ceilometer offers various transformers which can be used to manipulate data in the pipeline.
Publishing the data
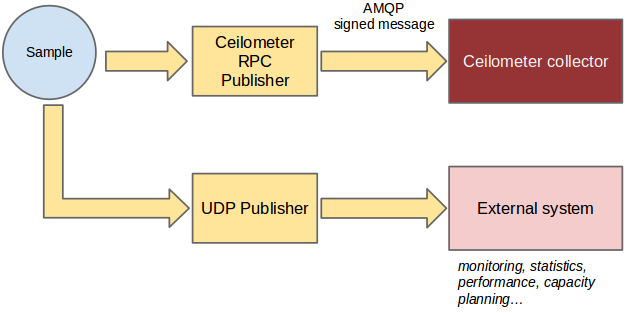
Currently, processed data can be published using 4 different transports: notifier, a notification based publisher which pushes samples to a message queue which can be consumed by the collector or an external system; rpc, a relatively secure, synchronous RPC based publisher; udp, which publishes samples using UDP packets; and kafka, which publishes data to a Kafka message queue to be consumed by any system that supports Kafka.
Storing the data
Collector Service
The collector daemon gathers the processed event and metering data captured by the notification and polling agents. It validates the incoming data and (if the signature is valid) then writes the messages to a declared target: database, file, or http.
Supported databases
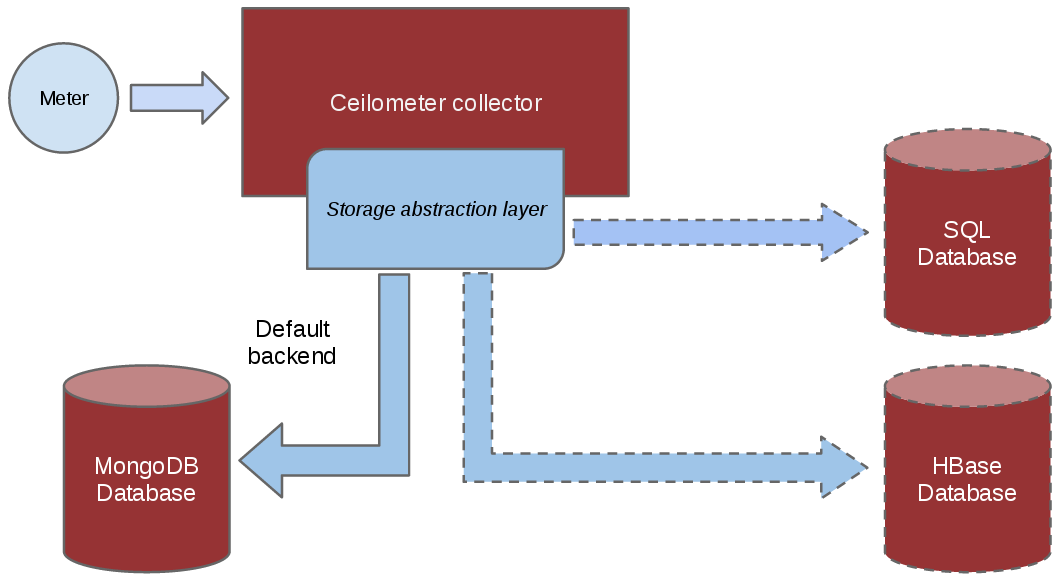
Since the beginning of the project, a plugin model has been put in
place to allow for various types of database backends to be used. A list
of supported backends can be found in the choosing_db_backend section of the documentation for
more details.
In the Juno and Kilo release cycle, Ceilometer's database was divided into three separate connections: alarm, event, and metering. This allows deployers to either continue storing all data within a single database or to divide the data into their own databases, tailored for its purpose. For example, a deployer could choose to store alarms in an SQL backend while storing events and metering data in a NoSQL backend.
Note
We do not guarantee that we won't change the DB schema, so it is highly recommended to access the database through the API and not use direct queries.
Accessing the data
API Service
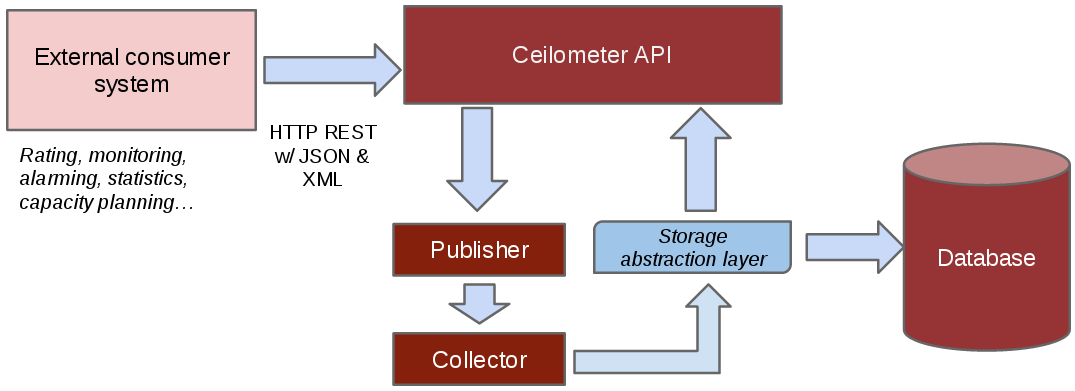
If the collected data from polling and notification agents are stored
in supported database(s) (see the section which-db), it is possible that the schema of these
database(s) may evolve over time. For this reasons, we offer a REST API
and recommend that you access the collected data via the API rather than
by accessing the underlying database directly.
If the way in which you wish to access your data is not yet supported by the API, please contact us with your feedback, so that we can improve the API accordingly.
The list of currently built in meters <measurements>
is available in the developer documentation, and it is also relatively
easy to add your own (and eventually contribute it).
Ceilometer is part of OpenStack, but is not tied to OpenStack's definition of "users" and "tenants." The "source" field of each sample refers to the authority defining the user and tenant associated with the sample. Deployers can define custom sources through a configuration file, and then create agents to collect samples for new meters using those sources. This means that you can collect data for applications running on top of OpenStack, such as a PaaS or SaaS layer, and use the same tools for metering your entire cloud.
Moreover, end users can also send their own application specific data <user-defined-data>
into the database through the REST API for a various set of use cases
(see the section "Alarming" later in this article).
Evaluating the data
Alarming Service
The alarming component of Ceilometer, first delivered in the Havana
version, allows you to set alarms based on threshold evaluation for a
collection of samples. An alarm can be set on a single meter, or on a
combination. For example, you may want to trigger an alarm when the
memory consumption reaches 70% on a given instance if the instance has
been up for more than 10 min. To setup an alarm, you will call Ceilometer's API server <alarms-api> specifying
the alarm conditions and an action to take.
Of course, if you are not administrator of the cloud itself, you can
only set alarms on meters for your own components. You can also send your own meters <user-defined-data> from
within your instances, meaning that you can trigger alarms based on
application centric data.
There can be multiple form of actions, but two have been implemented so far:
HTTP callback: you provide a URL to be called whenever the alarm has been set off. The payload of the request contains all the details of why the alarm was triggered.log: mostly useful for debugging, stores alarms in a log file.
For more details on this, we recommend that you read the blog post by Mehdi Abaakouk Autoscaling with Heat and Ceilometer. Particular attention should be given to the section "Some notes about deploying alarming" as the database setup (using a separate database from the one used for metering) will be critical in all cases of production deployment.