7.2 KiB
7.2 KiB
Ceph RBD performance report
- Abstract
This document includes Ceph RBD performance test results for 40 OSD nodes. Test cluster contain 40 OSD servers and forms 581TiB ceph cluster.
Environment description
Environment contains 3 types of servers:
- ceph-mon node
- ceph-osd node
- compute node
| Role | Servers count | Type |
|---|---|---|
| compute | 1 | 1 |
| ceph-mon | 3 | 1 |
| ceph-osd | 40 | 2 |
Hardware configuration of each server
All servers have 2 types of configuration describing in table below
| server | vendor,model | Dell PowerEdge R630 |
|
vendor,model ----------------+ processor_count ----------------+ core_count ----------------+ frequency_MHz | Intel,E5-2680 v3 ---------------------------------+ 2 ---------------------------------+ 12 ---------------------------------+ 2500 |
|
vendor,model ----------------+ amount_MB | Samsung, M393A2G40DB0-CPB ---------------------------------+ 262144 |
|
interface_name s ----------------+ vendor,model ----------------+ bandwidth ----------------+ interface_names ----------------+ vendor,model ----------------+ bandwidth | eno1, eno2 ---------------------------------+ Intel,X710 Dual Port ---------------------------------+ 10G ---------------------------------+ enp3s0f0, enp3s0f1 ---------------------------------+ Intel,X710 Dual Port ---------------------------------+ 10G |
|
dev_name ----------------+ vendor,model ----------------+ SSD/HDD ----------------+ size |
/dev/sda ---------------------------------+ | raid1 - Dell, PERC H730P Mini | 2 disks Intel S3610 ---------------------------------+ SSD ---------------------------------+ 3,6TB |
| server | vendor,model | Lenovo ThinkServer RD650 |
|
vendor,model ----------------+ processor_count ----------------+ core_count ----------------+ frequency_MHz | Intel,E5-2670 v3 -------------------------------+ 2 -------------------------------+ 12 -------------------------------+ 2500 |
|
vendor,model ----------------+ amount_MB | Samsung, M393A2G40DB0-CPB -------------------------------+ 131916 |
|
interface_names ----------------+ vendor,model ----------------+ bandwidth ----------------+ interface_names ----------------+ vendor,model ----------------+ bandwidth | enp3s0f0, enp3s0f1 -------------------------------+ Intel,X710 Dual Port -------------------------------+ 10G -------------------------------+ ens2f0, ens2f1 -------------------------------+ Intel,X710 Dual Port -------------------------------+ 10G |
|
vendor,model ----------------+ SSD/HDD ----------------+ size ----------------+ vendor,model ----------------+ SSD/HDD ----------------+ size | 2 disks Intel S3610 -------------------------------+ SSD -------------------------------+ 799GB -------------------------------+ 10 disks 2T -------------------------------+ HDD -------------------------------+ 2TB |
Network configuration of each server
All servers have same network configuration:
Software configuration on servers with controller, compute and compute-osd roles
Ceph was deployed by Decapod tool. Cluster config for decapod: ceph_config.yaml <configs/ceph_config.yaml>
| Software | Version |
|---|---|
| Ceph | Jewel |
| Ubuntu | Ubuntu 16.04 LTS |
You can find outputs of some commands and /etc folder in the following archives:
ceph-osd-1.tar.gz <configs/ceph-osd-1.tar.gz>ceph-mon-1.tar.gz <configs/ceph-mon-1.tar.gz>compute-1.tar.gz <configs/compute-1.tar.gz>Testing process
- Run virtual machine on compute node with attached RBD disk.
- SSH into VM operation system
- Clone Wally repository.
- Create
ceph_raw.yaml <configs/ceph_raw.yaml>file in cloned repository - Run command python -m wally test ceph_rbd_2 ./ceph_raw.yaml
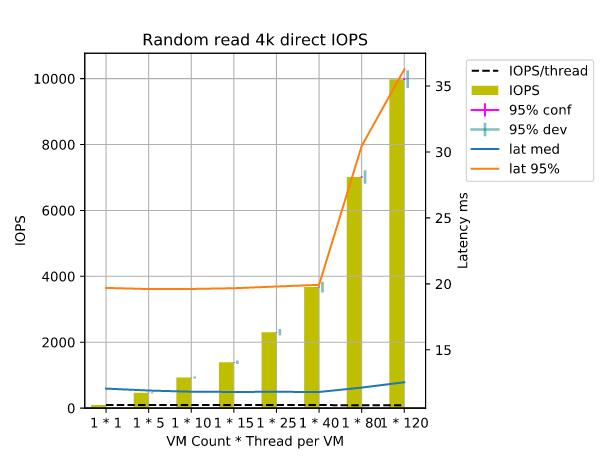
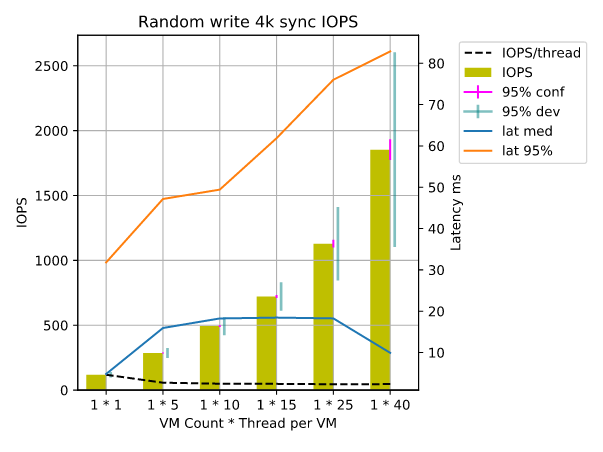
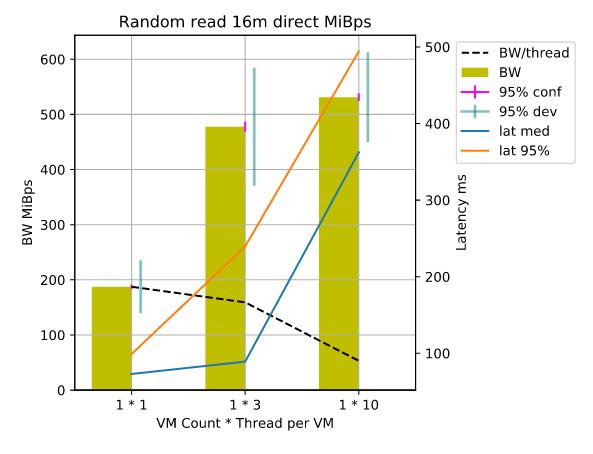
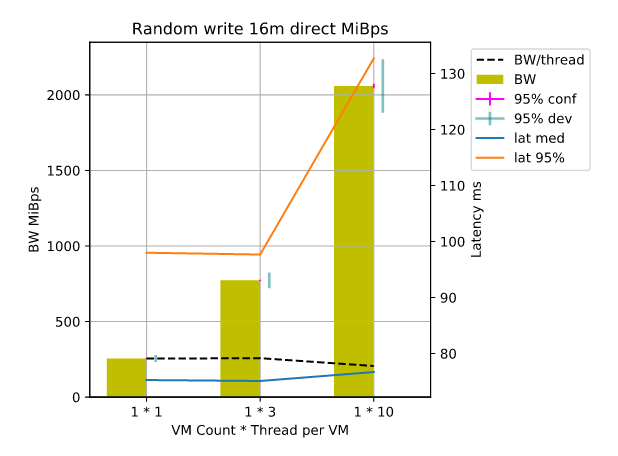
As a result we got the following HTML file:
Report.html <configs/Report.html>


