37 KiB
Results of measuring performance of Cobbler
- Abstract
This document includes performance test results of Cobbler service as a provisioning system. All test have been performed regarding
Measuring_performance_of_provisioning_systems
Environment description
Hardware configuration of each server
|
name ----------------+ role ----------------+ vendor,model ----------------+ operating_system | 728983-comp-disk-242 ------------------------+ Cobbler ------------------------+ HP,DL380 Gen9 ------------------------+ | 3.13.0-76-generic | Ubuntu-trusty | x86_64 | nodes-{1..195} ------------------------+ nodes to be provisioned ------------------------+ HP,DL380 Gen9 ------------------------+ | 3.13.0-83-generic | Ubuntu-trusty | x86_64 |
|
vendor,model ----------------+ processor_count ----------------+ core_count ----------------+ frequency_MHz | Intel,E5-2680 v3 ------------------------+ 2 ------------------------+ 12 ------------------------+ 2500 | Intel,E5-2680 v3 ------------------------+ 2 ------------------------+ 12 ------------------------+ 2500 |
|
vendor,model ----------------+ amount_MB | HP,752369-081 ------------------------+ 262144 | HP,752369-081 ------------------------+ 262144 |
|
interface_name ----------------+ vendor,model ----------------+ bandwidth | p1p1 ------------------------+ Intel,X710 Dual Port ------------------------+ 10G | p1p1 ------------------------+ Intel,X710 Dual Port ------------------------+ 10G |
|
dev_name ----------------+ vendor,model ----------------+ SSD/HDD ----------------+ size |
/dev/sda ------------------------+ | raid10 - HP P840 | 12 disks EH0600JEDHE ------------------------+ HDD ------------------------+ 3,6TB | /dev/sda ------------------------+ | raid10 - HP P840 | 12 disks EH0600JEDHE ------------------------+ HDD ------------------------+ 3,6TB |
Network scheme and part of configuration of hardware network switches
Network scheme of the environment:
Here is the part of switch configuration for each switch port which connected to p1p1 interface of a server:
switchport mode trunk
switchport trunk native vlan 600
switchport trunk allowed vlan 600-602,630-649
spanning-tree port type edge trunk
spanning-tree bpduguard enable
no snmp trap link-status
Software configuration of Cobbler service
Installation of Cobbler:
To install and configure Cobbler section Installation script and config files has been used.
The nodes has Intel X710 NIC therefore we had to provide i40e driver to Debian installer. The following steps was performed to do that:
mkdir /var/www/html/ubuntu_custom_packages
cd /var/www/html/ubuntu_custom_packages
wget <address_to_builded_deb_package>
dpkg-scanpackages . /dev/null | gzip -9c > Packages.gz
Cobbler has the following issue https://github.com/cobbler/cobbler/issues/1530. Due the bug we can't add one more repository for provisioning step. Also we need to allow root access via ssh after provisioning. Therefore:
sed -i s/"\$SNIPPET('late_apt_repo_config')"/\
         "\$SNIPPET('late_apt_repo_config')\\n\
          echo \"deb http:\/\/\$server\/ubuntu_custom_packages\/ .\/\" \>\> \/etc\/apt\/sources.list\\n\
          apt\-get update \&\& apt\-get \-y \-\-force\-yes install i40e\-dkms\\n\
          sed \-i \'s\/PermitRootLogin\.\*\/PermitRootLogin yes\/g\' \/etc\/ssh\/sshd_config"/ \
/var/lib/cobbler/scripts/preseed_late_default| Software | Version |
|---|---|
| Ubuntu | Ubuntu 14.04.3 LTS |
| Cobbler | 2.6.11 |
| Apache2 | 2.4.7 |
| Bind9 | 1:9.9.5 |
| tftpd-hpa | 5.2 |
| isc-dhcp-server | 4.2.4 |
| syslinux | 6.03 |
Test tool:
Script to start provisioning and collect metrics was used to collect performance metrics during the tests.
Operating system configuration:
You can find outputs of some commands and /etc folder in the
following archive: server_description_of_728983-comp-disk-242.tar.gz <configs/server_description_of_728983-comp-disk-242.tar.gz>
Software configuration of provisioned nodes
| Software | Version |
|---|---|
| Ubuntu | Ubuntu 14.04.3 LTS |
Operating system:
You can find outputs of some commands and /etc folder in the
following archive: server_description_of_728997-comp-disk-228.tar.gz <configs/server_description_of_728997-comp-disk-228.tar.gz>
Testing process
Preparation
- 1.
-
Cobbler was installed on top of 728983-comp-disk-242 server as described in Installation of Cobbler: section.
- 2.
-
systems.list file (with matching of server name, server ILO address and mac address of interface connected to Cobbler) was created:
root@728983-comp-disk-242:~# tail -3 systems.list
729691-comp-disk-201,10.15.242.170,68:05:ca:38:64:d4
729692-comp-disk-200,10.15.242.171,3c:fd:fe:9c:62:30
729693-comp-disk-199,10.15.242.172,3c:fd:fe:9c:68:3c- 3.
-
Cobbler systems was added using Script to add cobbler systems.
Testing. Case when pxlinux downloads kernel via HTTP
During Installation of
Cobbler: we copied /etc/cobbler/pxe/pxesystem.template (pxesystem_http). It means
that on the step when pxelinux downloads kernel and initrd files via
HTTP protocol.
- 1.
-
Performed Script to start provisioning and collect metrics with option "1" to provision 1 server.
bash -ex measure.sh 1- Save /var/log/results.csv file
mv /var/log/results.csv /var/log/results-http-1.csv- 3.
-
The steps 1 and 2 was repeated with the following numbers of nodes: 1,10,20,40
As a result of this part we got the following CSV files:
METRICS(NUMBER_OF_NODES=1) <./results/results-http-1.csv>
METRICS(NUMBER_OF_NODES=10) <./results/results-http-10.csv>
METRICS(NUMBER_OF_NODES=20) <./results/results-http-20.csv>
METRICS(NUMBER_OF_NODES=40) <./results/results-http-40.csv>
During the las test when we provisioned 40 nodes 2 nodes wasn't provisioned due the issue Linux kernel can't be downloaded by pxelinux via HTTP
Testing. Case when pxlinux downloads kernel via TFTP
During the following steps we change pxe configurations for all systems to download kernel and initrd files via TFTP protocol.
- Change pxe template
sed -i s/"http:\/\/\$server:\$http_port\/cblr\/"// \
/etc/cobbler/pxe/pxesystem.template- 2.
-
Performed Script to start provisioning and collect metrics with option "1" to provision 1 server.
bash -ex measure.sh 1- Save /var/log/results.csv file
mv /var/log/results.csv /var/log/results-http-1.csv- 4.
-
The steps 2 and 3 was repeated with the following numbers of nodes: 1,10,20,40,80,160,195
As a result of this part we got the following CSV files:
METRICS(NUMBER_OF_NODES=1) <./results/results-tftp-1.csv>
METRICS(NUMBER_OF_NODES=10) <./results/results-tftp-10.csv>
METRICS(NUMBER_OF_NODES=20) <./results/results-tftp-20.csv>
METRICS(NUMBER_OF_NODES=40) <./results/results-tftp-40.csv>
METRICS(NUMBER_OF_NODES=80) <./results/results-tftp-80.csv>
METRICS(NUMBER_OF_NODES=160) <./results/results-tftp-160.csv>
METRICS(NUMBER_OF_NODES=195) <./results/results-tftp-195.csv>
Results
Case when pxlinux downloads kernel via HTTP
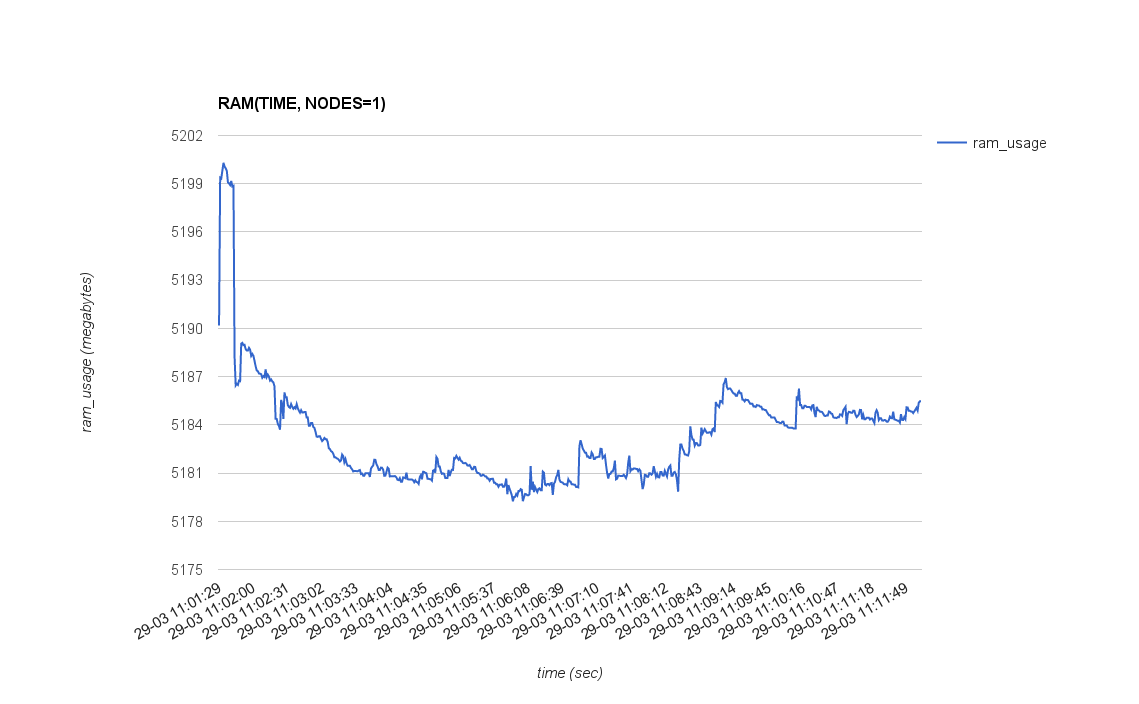
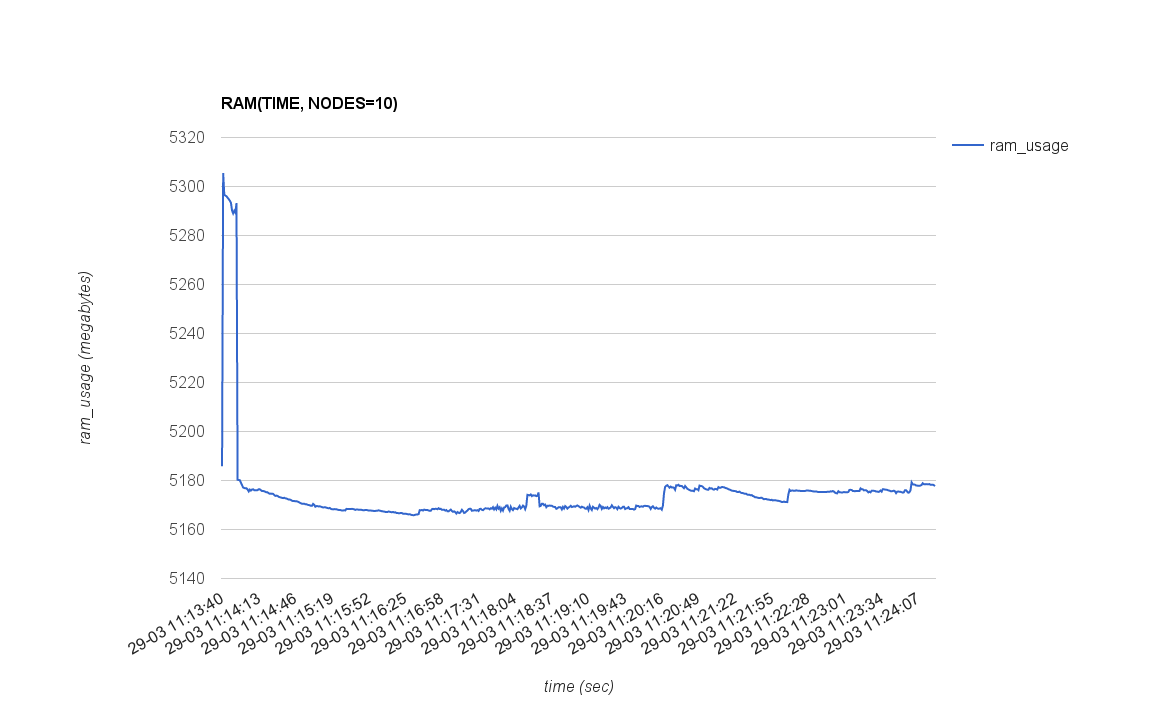
After simple processing results the following plots for performance metrics collected during provisioning of the nodes in depend on time created (click to expand an image):
CPU(TIME), RAM(TIME)
| Number of nodes | Plot CPU(TIME) | Plot RAM(TIME) |
|---|---|---|
| 1 | 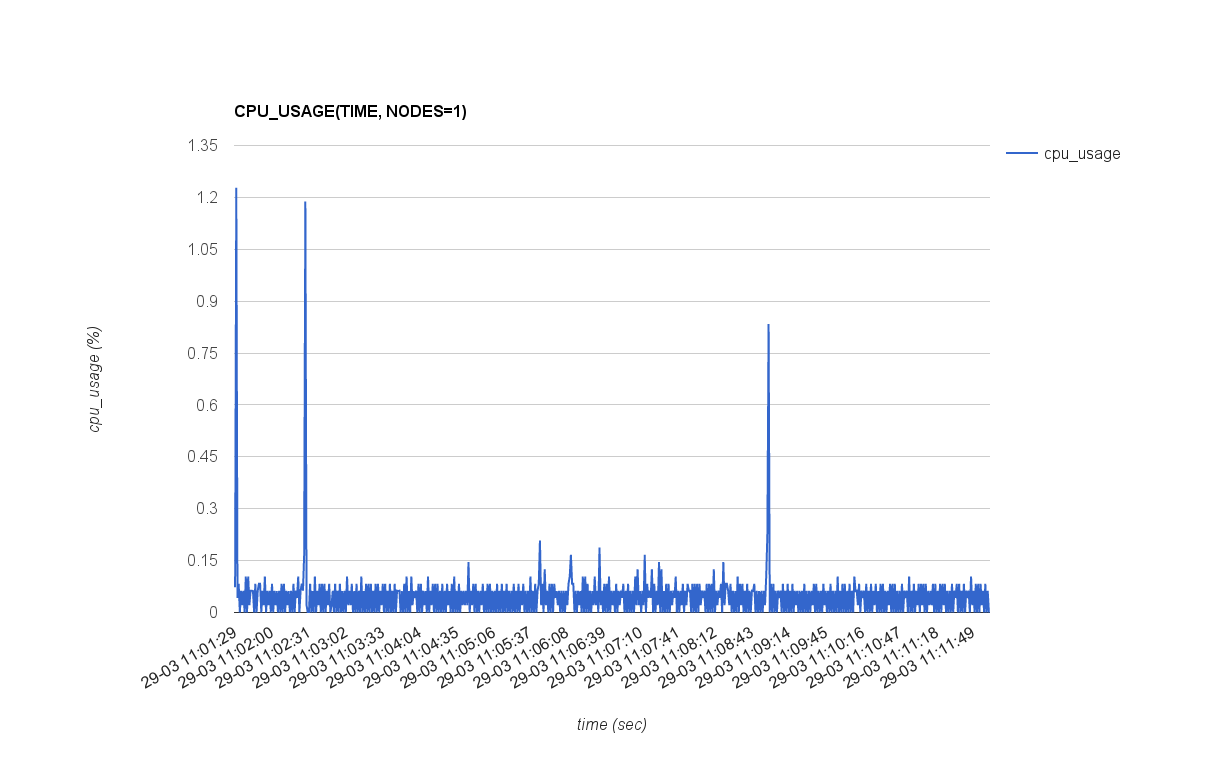 |
 |
| 10 | 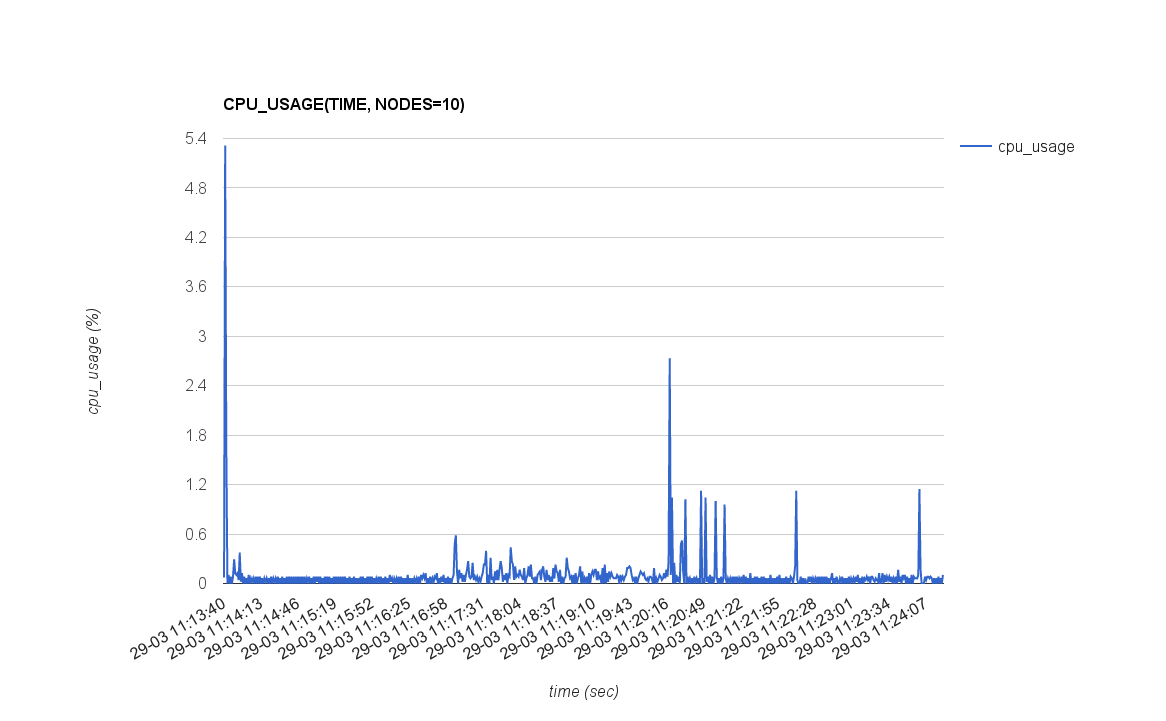 |
 |
| 20 | 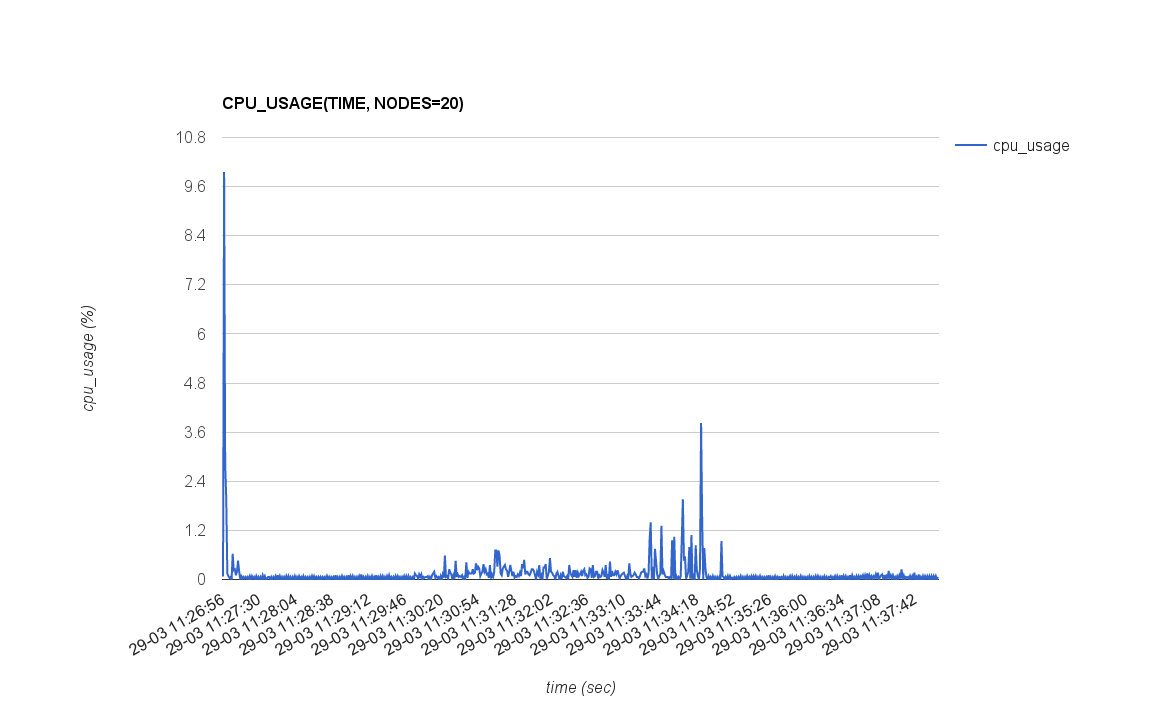 |
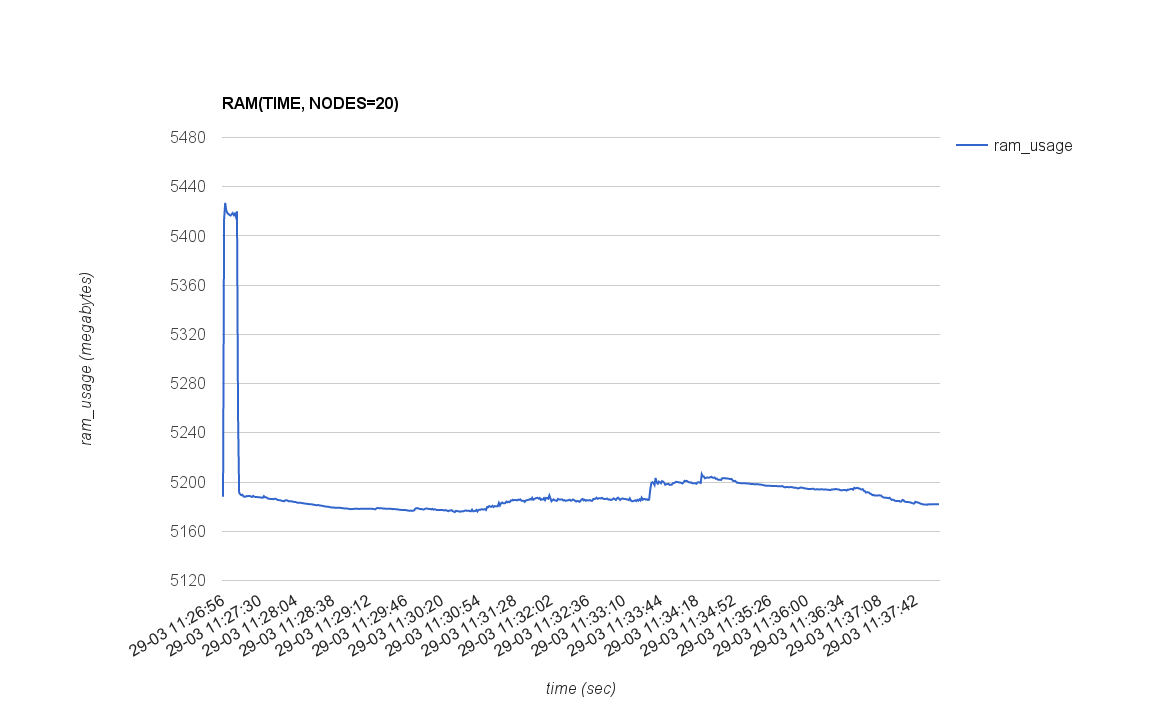 |
| 40 | 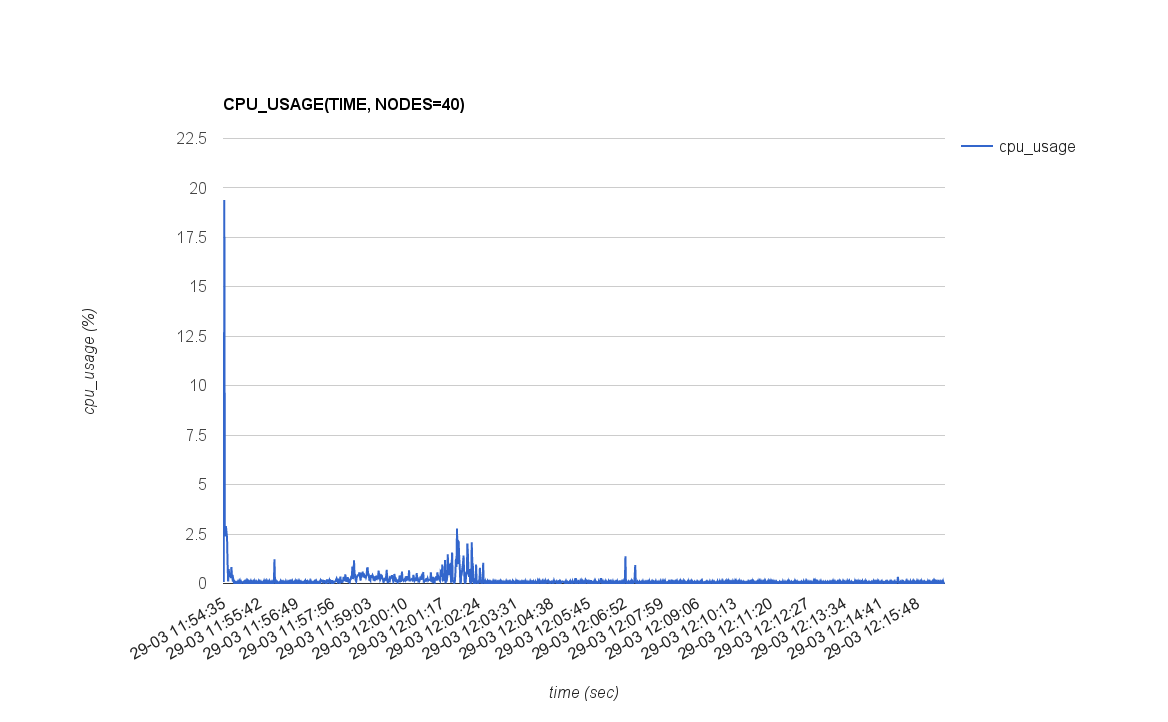 |
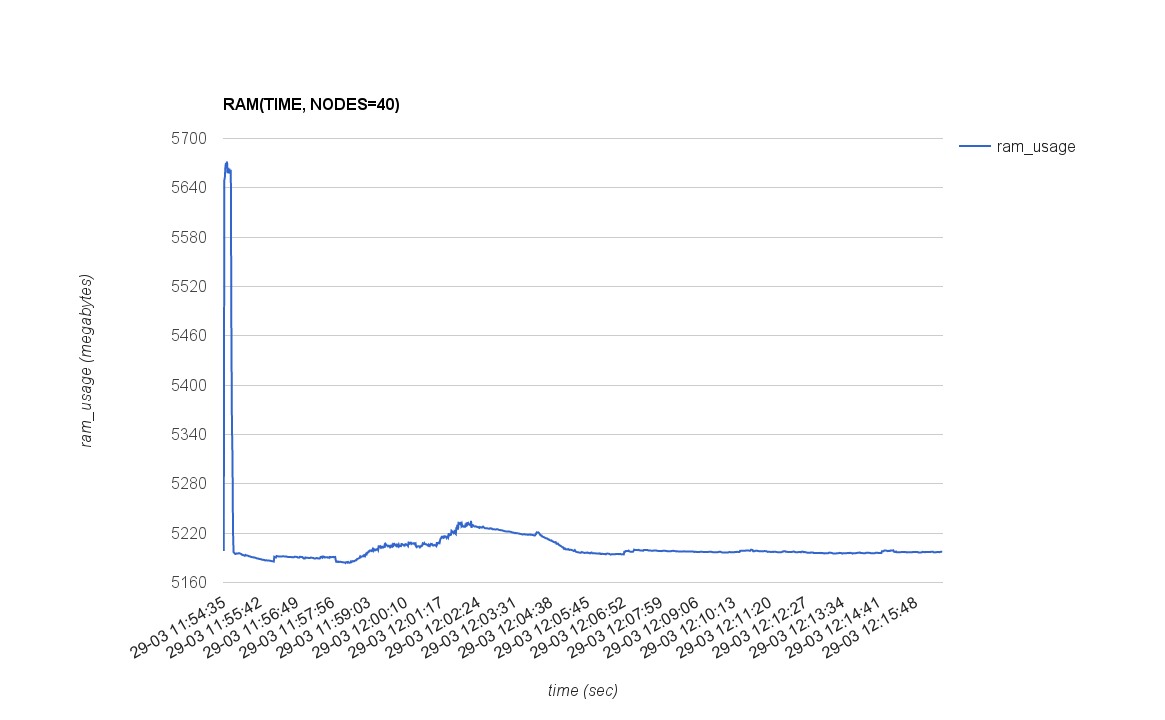 |
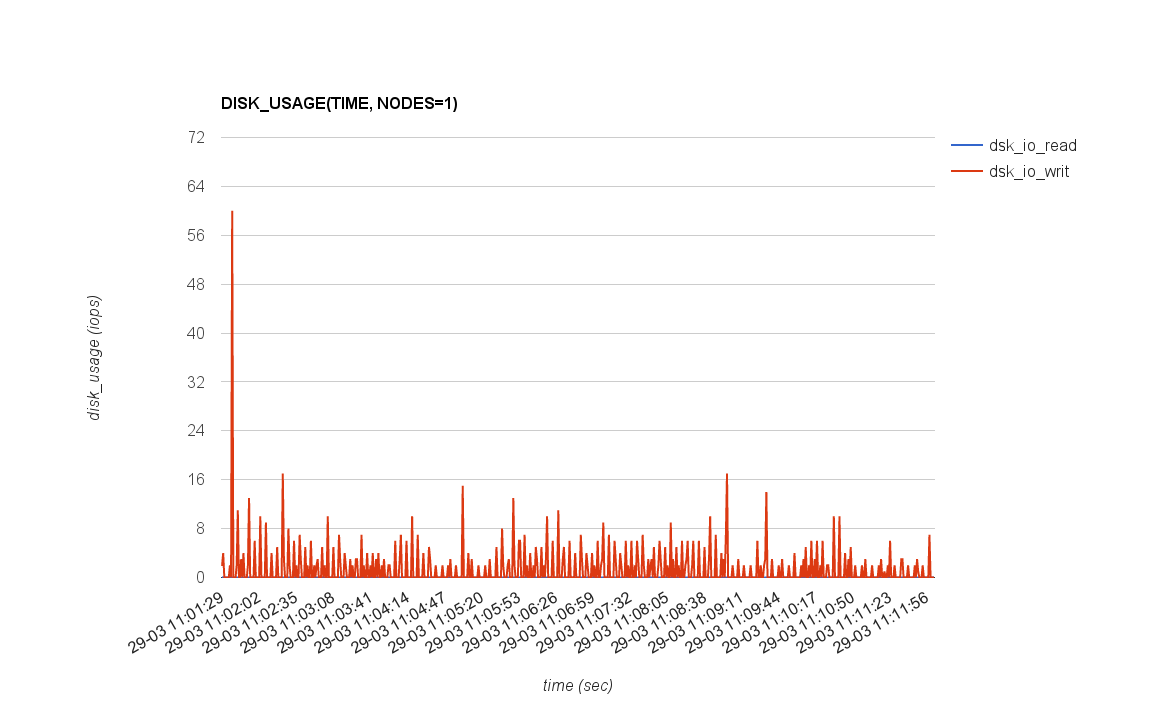
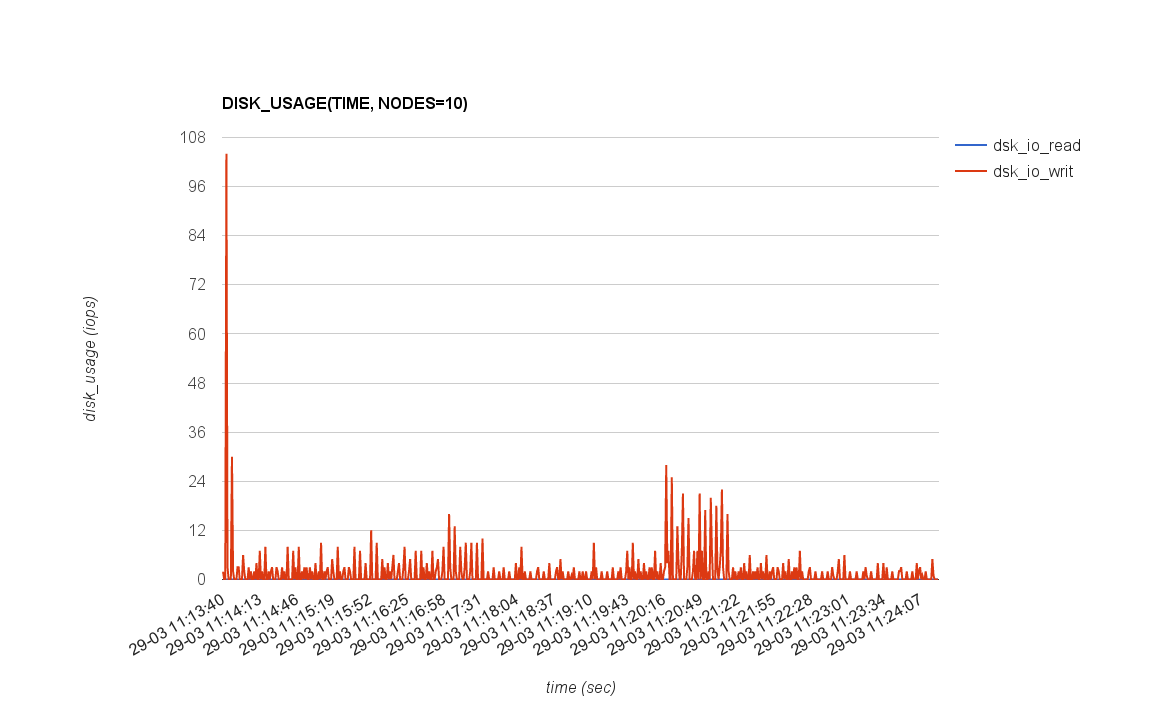
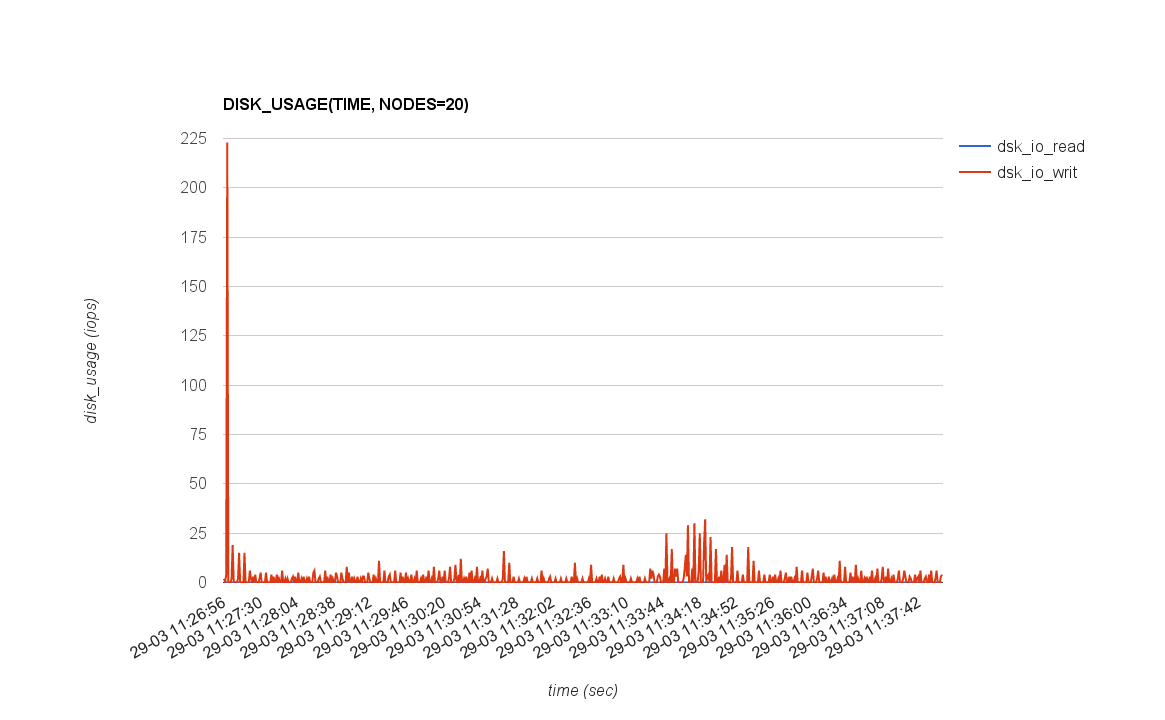
NET(TIME), DISK(TIME)
| Number of nodes | Plot NET(TIME) | Plot DISK(TIME) |
|---|---|---|
| 1 | 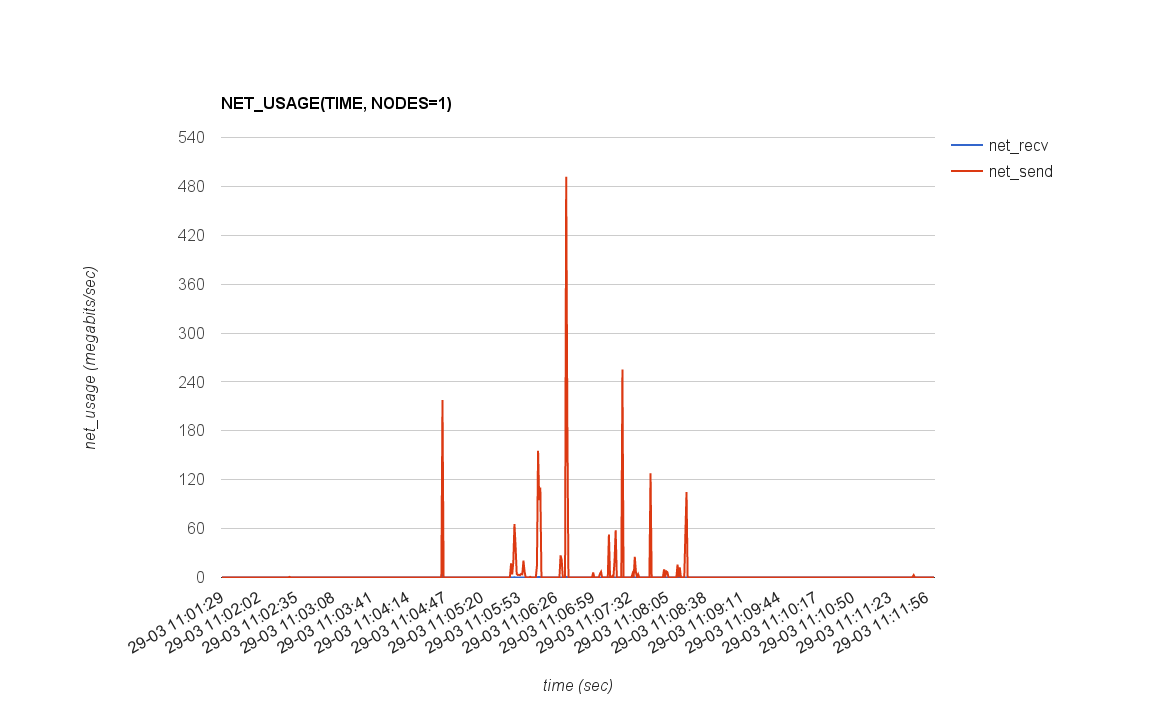 |
 |
| 10 | 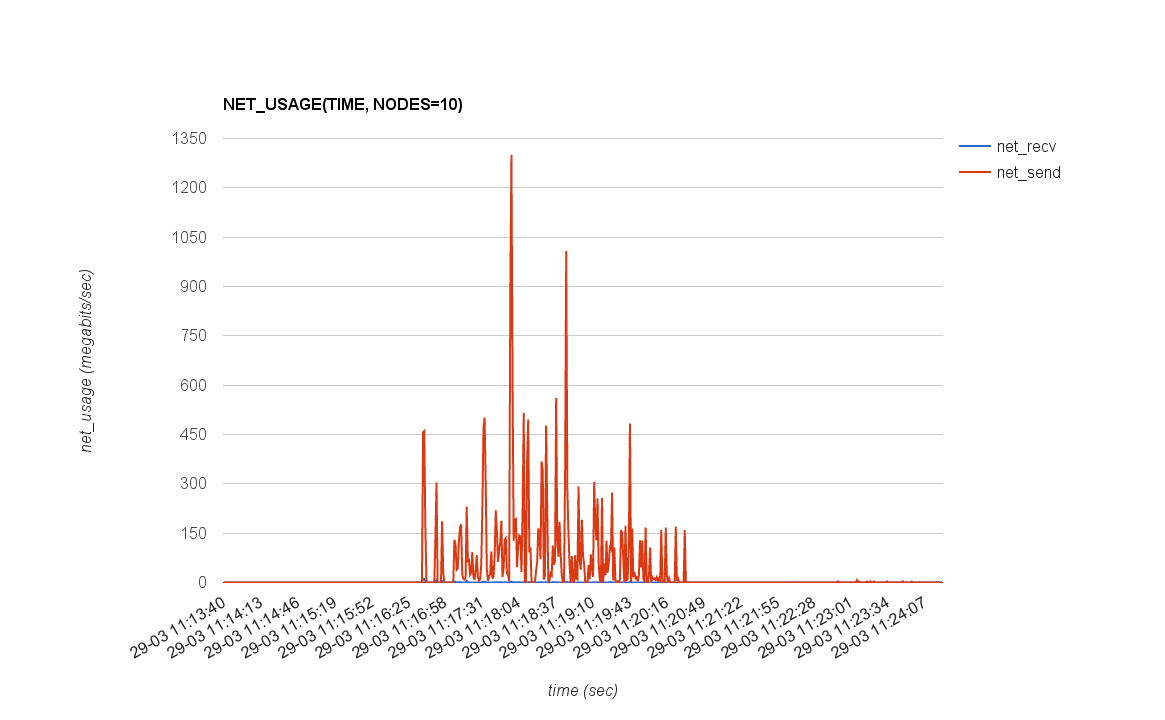 |
 |
| 20 | 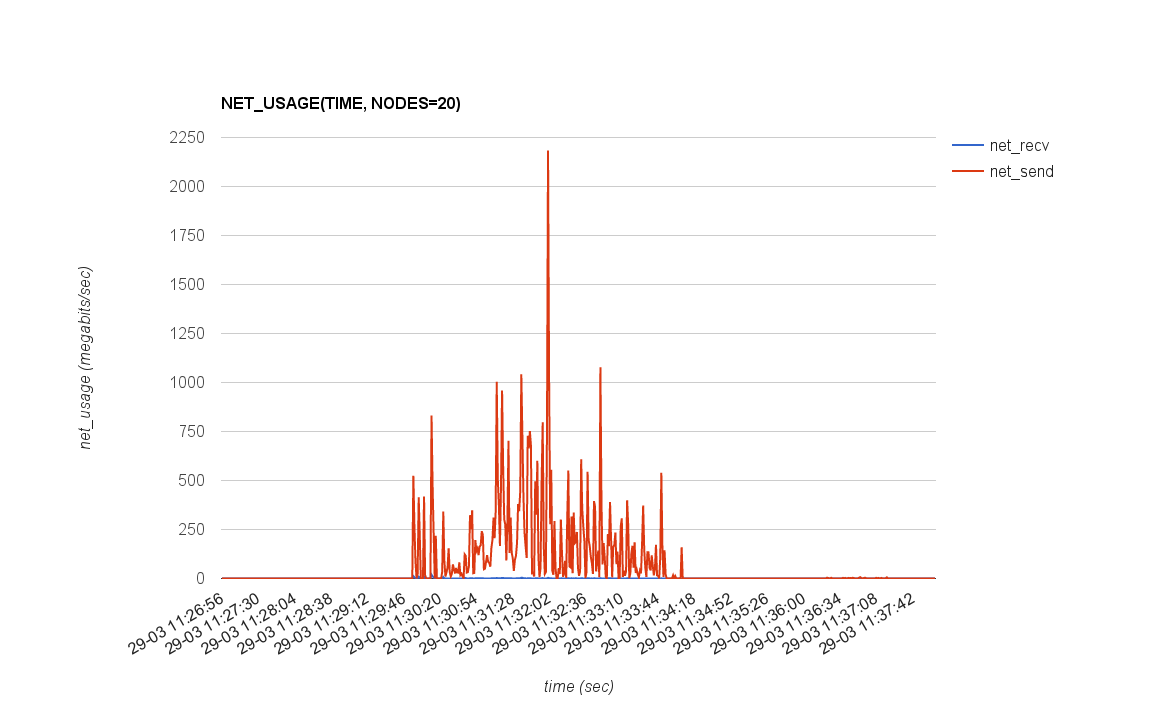 |
 |
| 40 | 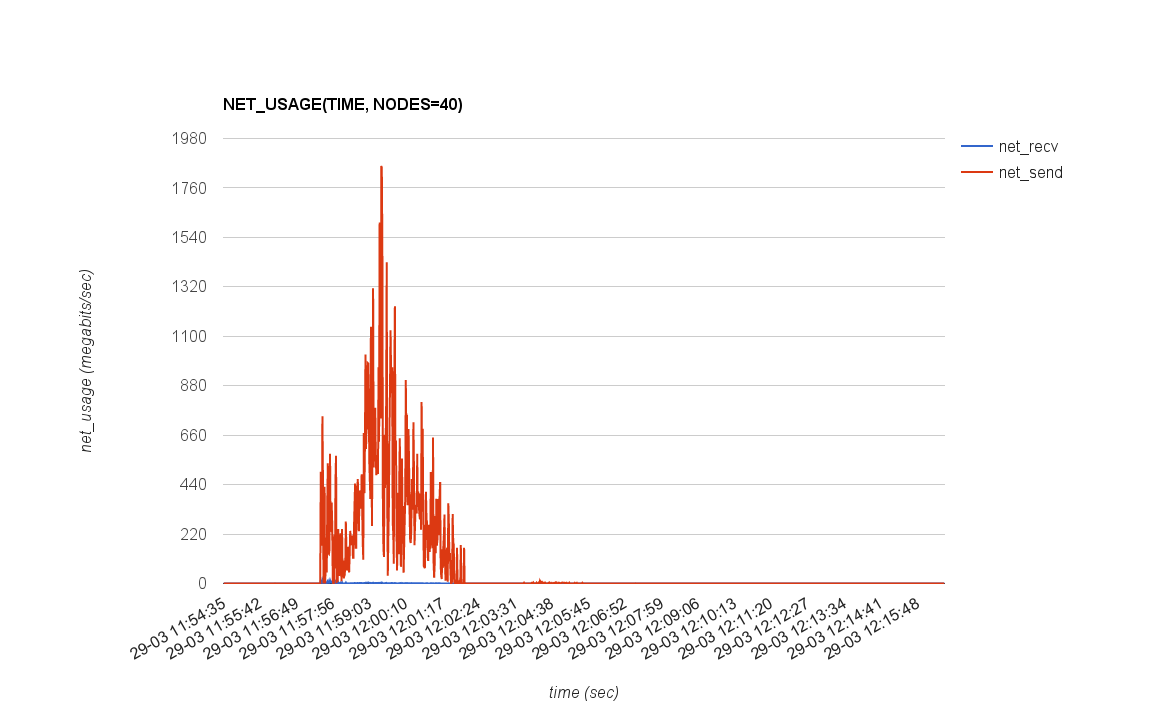 |
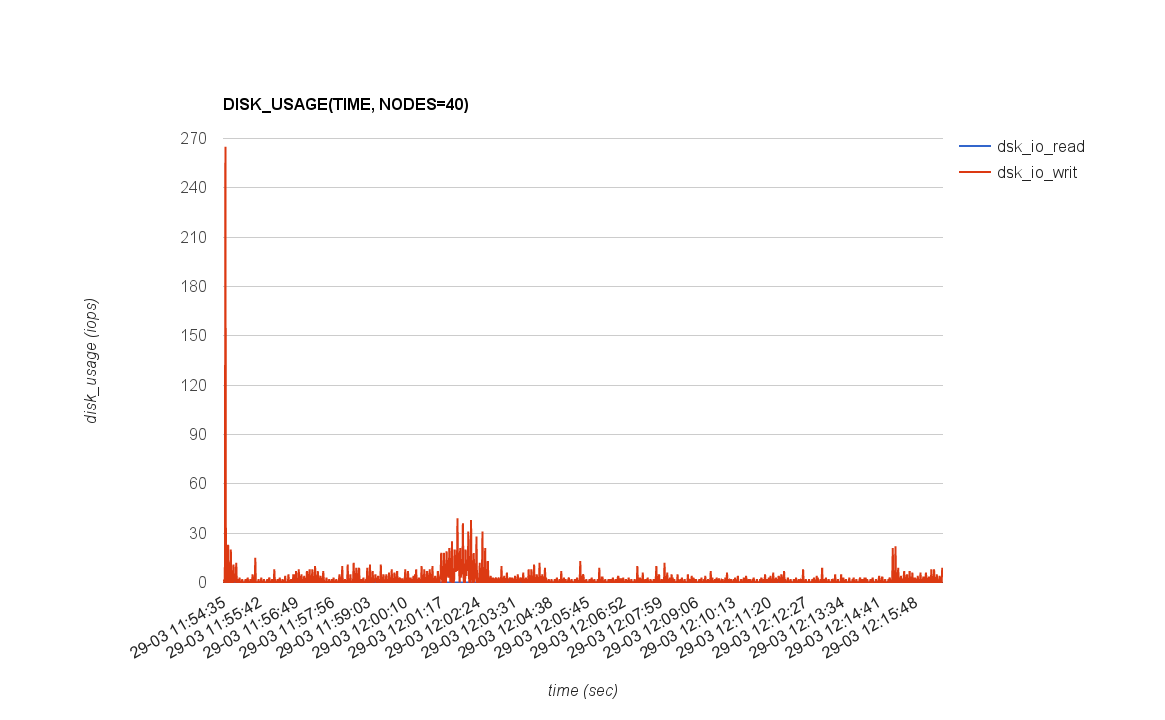 |
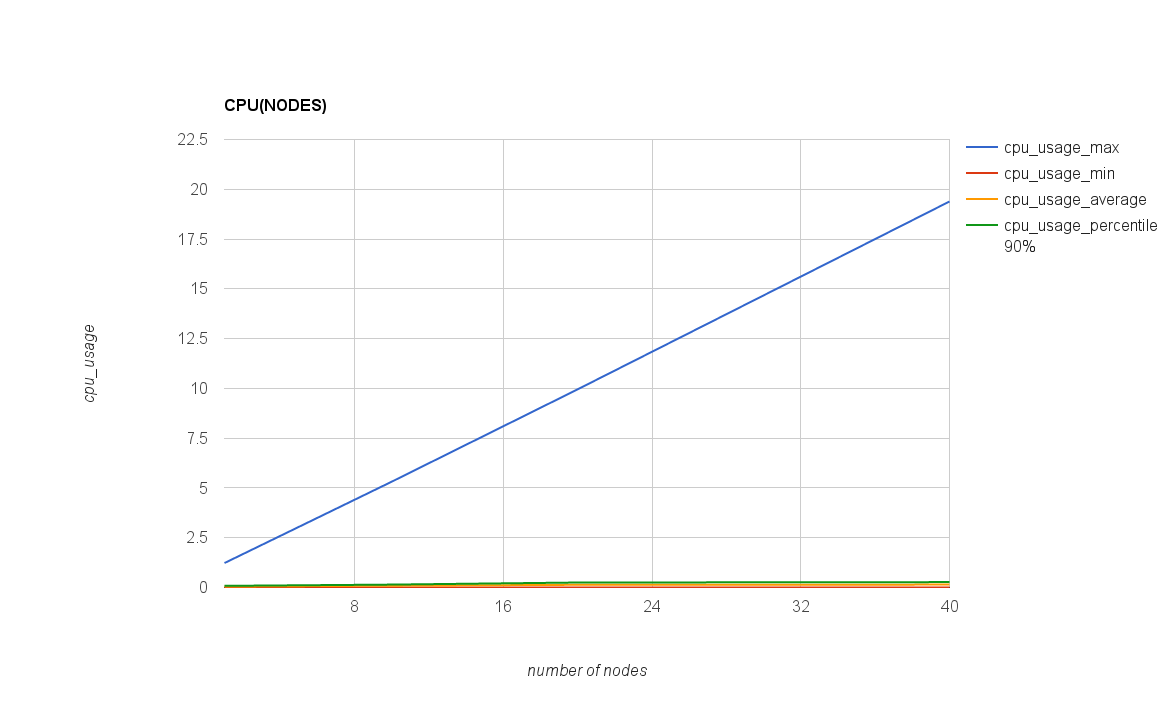
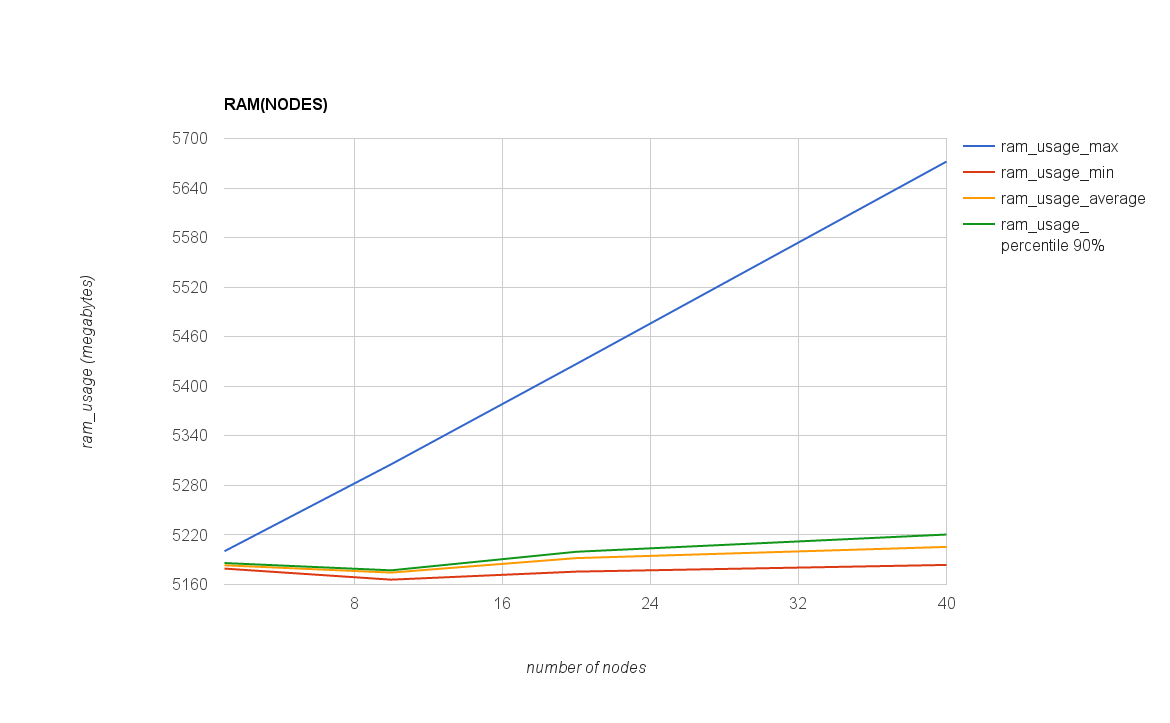
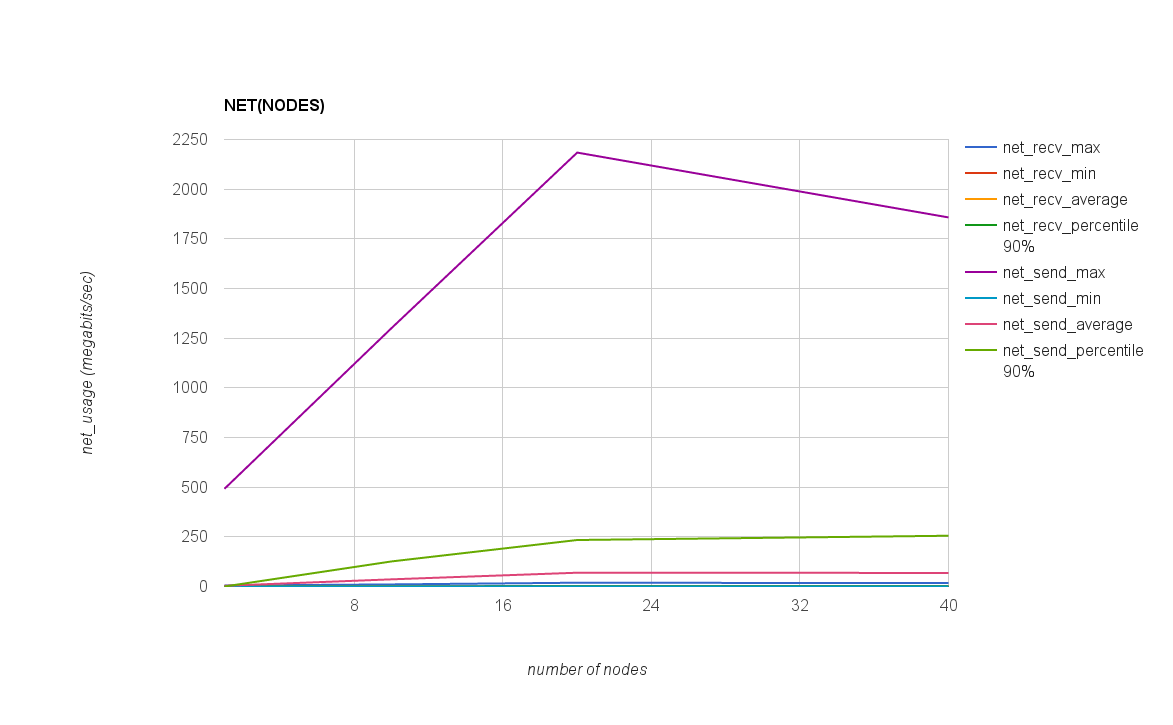
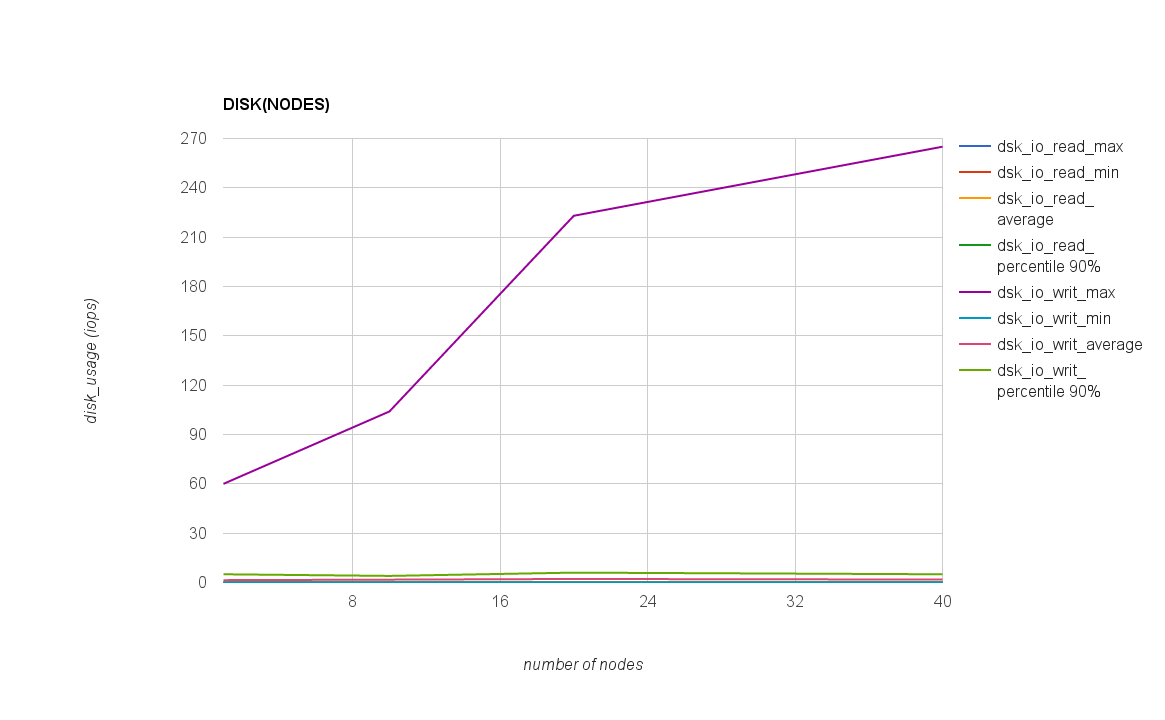
The following table and graphs show how performance metrics and provisioning time parameters depend on numbers of nodes.
| numbers of nodes | 1 | 10 | 20 | 40 |
|---|---|---|---|---|
| provisioning time | 633.341015606 | 642.138856745 | 667.484074798 | 1322.96068455 |
| cpu_usage_max | 1.228 | 5.316 | 9.954 | 19.386 |
| cpu_usage_min | 0 | 0 | 0 | 0 |
| cpu_usage_average | 0.04806940063 | 0.09161897356 | 0.1349446108 | 0.1451919879 |
| cpu_usage_percentile 90% | 0.083 | 0.146 | 0.25 | 0.271 |
| ram_usage_max | 5200.3 | 5305.52 | 5426.92 | 5672.05 |
| ram_usage_min | 5179.25 | 5165.86 | 5175.59 | 5183.7 |
| ram_usage_average | 5183.245536 | 5174.417621 | 5191.933563 | 5205.502789 |
| ram_usage_percentile 90% | 5185.981 | 5177.15 | 5199.619 | 5220.494 |
| net_recv_max | 4.922 | 10.5239 | 19.0217 | 17.0064 |
| net_recv_min | 0 | 0 | 0 | 0 |
| net_recv_average | 0.0235053613 | 0.188453268 | 0.3578001869 | 0.35373526 |
| net_recv_percentile 90% | 0.0126724 | 0.428462 | 0.8075162 | 0.9857374 |
| net_send_max | 491.92 | 1300.81 | 2184.08 | 1857.75 |
| net_send_min | 0 | 0 | 0 | 0 |
| net_send_average | 3.658875403 | 36.04228255 | 69.38244342 | 68.31148501 |
| net_send_percentile 90% | 0.01753312 | 126.2174 | 233.9985 | 255.4942 |
| dsk_io_read_max | 0.074 | 0.074 | 0.074 | 0.073 |
| dsk_io_read_min | 0 | 0 | 0 | 0 |
| dsk_io_read_average | 0.0001167192429 | 0.0001150855365 | 0.0001107784431 | 0.00005517762661 |
| dsk_io_read_percentile 90% | 0 | 0 | 0 | 0 |
| dsk_io_writ_max | 60 | 104 | 223 | 265 |
| dsk_io_writ_min | 0 | 0 | 0 | 0 |
| dsk_io_writ_average | 1.433591483 | 1.735454121 | 2.142062874 | 1.789037793 |
| dsk_io_writ_percentile 90% | 5 | 4 | 6 | 5 |
PROVISIONING_TIME(NODES)
CPU(NODES), RAM(NODES) ^^^^^^^^^^^^^^^^^^^^
| Plot CPU(NODES) | Plot RAM(NODES) |
|---|---|
 |
 |
NET(NODES), DISK(NODES)
| Plot NET(NODES) | Plot DISK(NODES) |
|---|---|
 |
 |
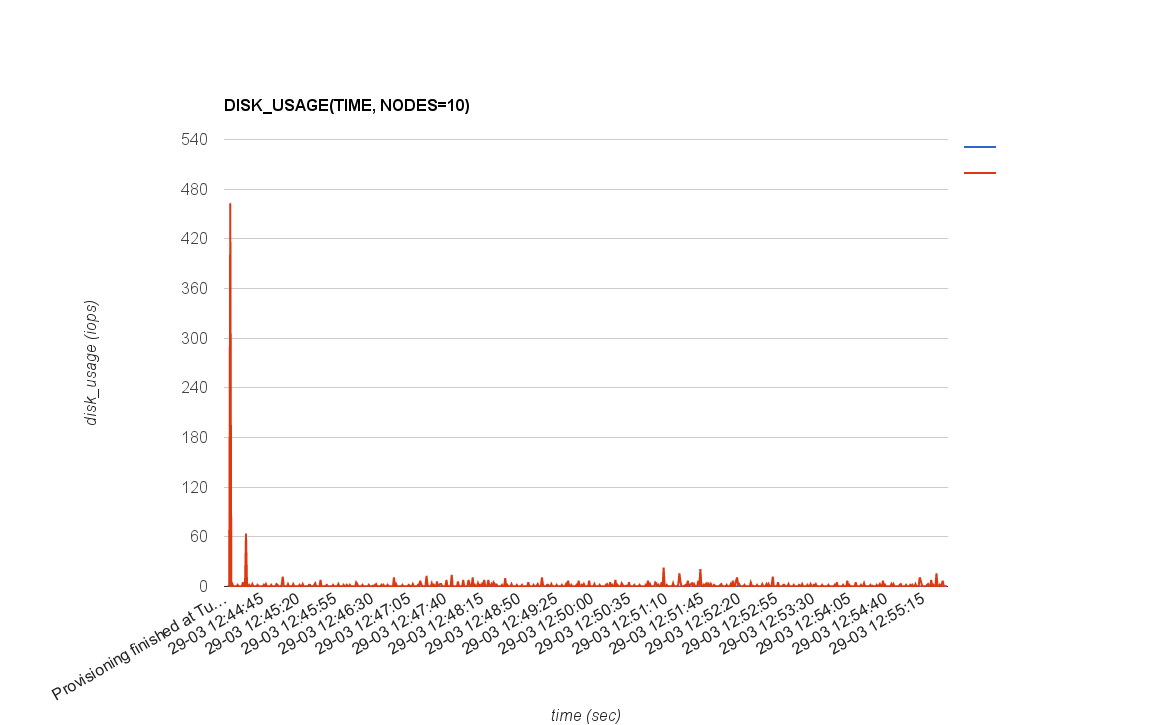
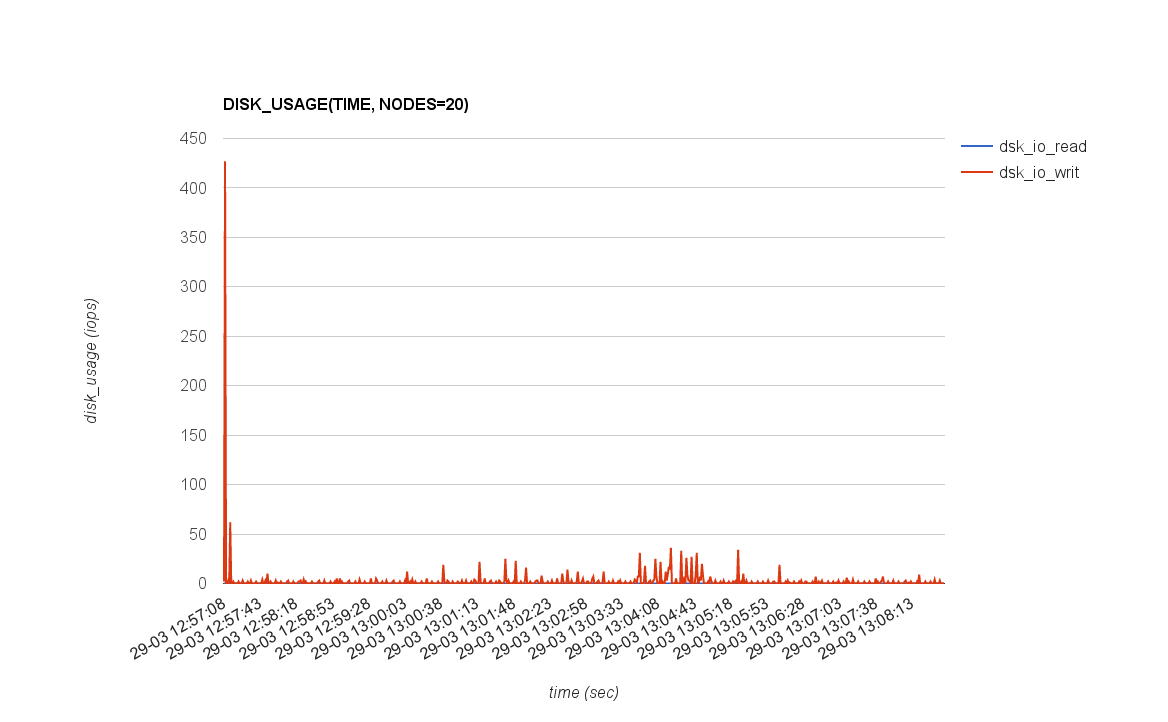
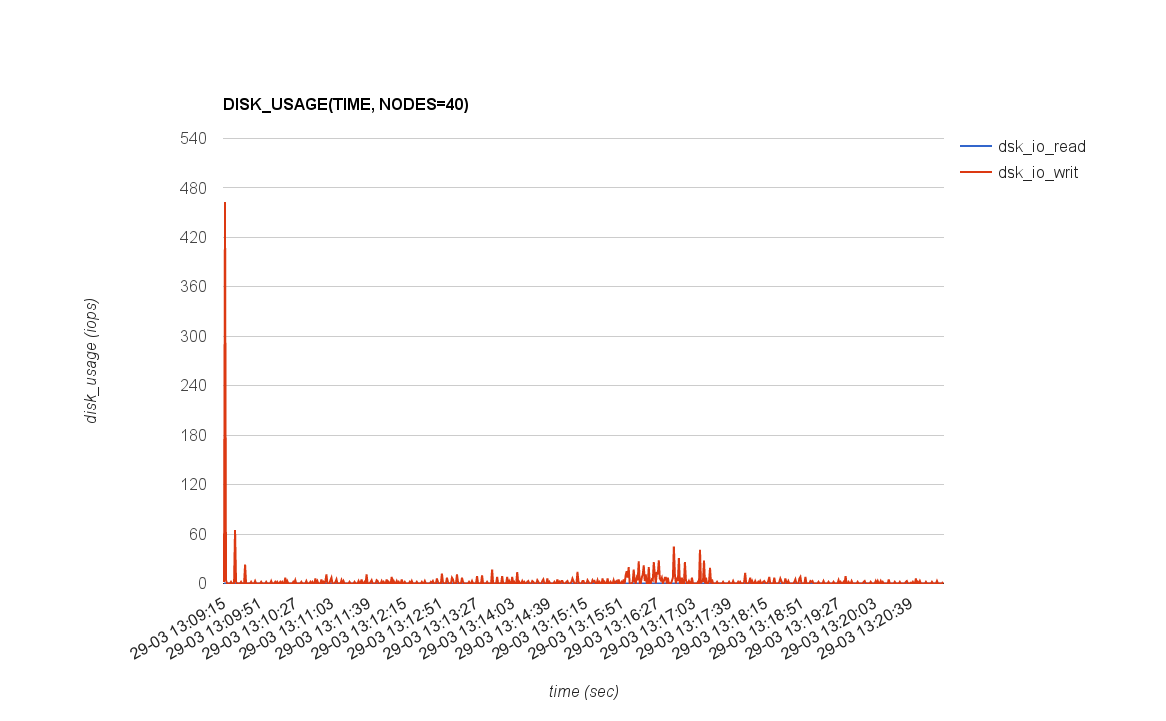
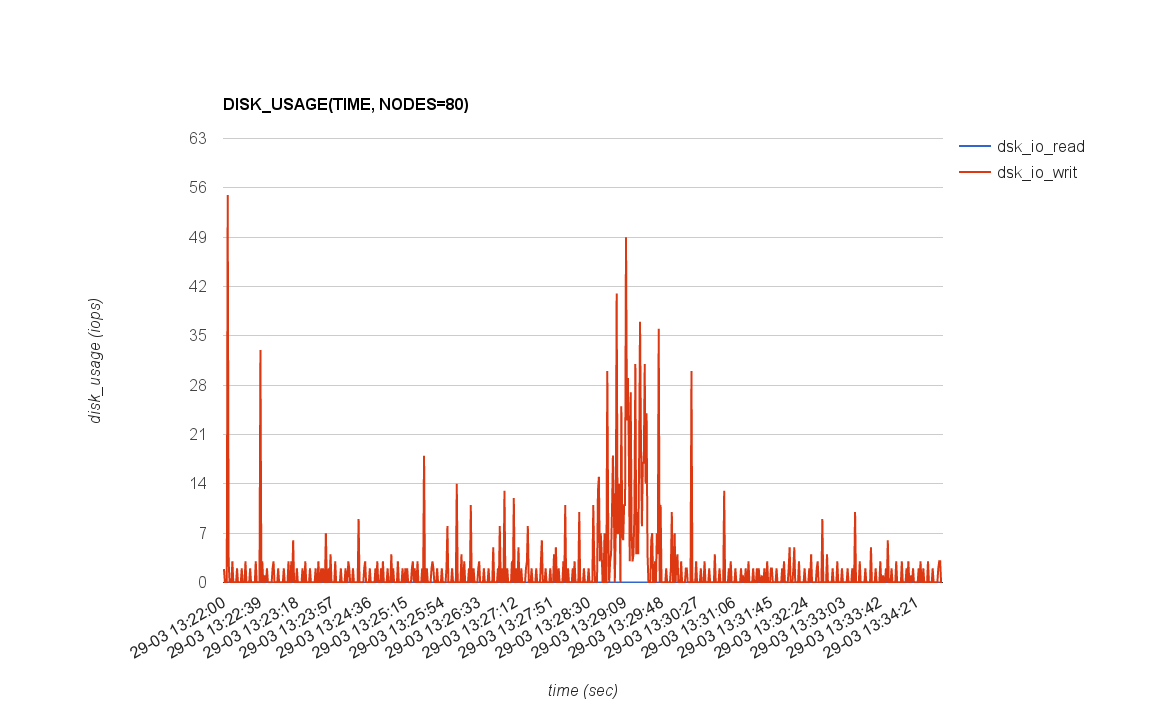
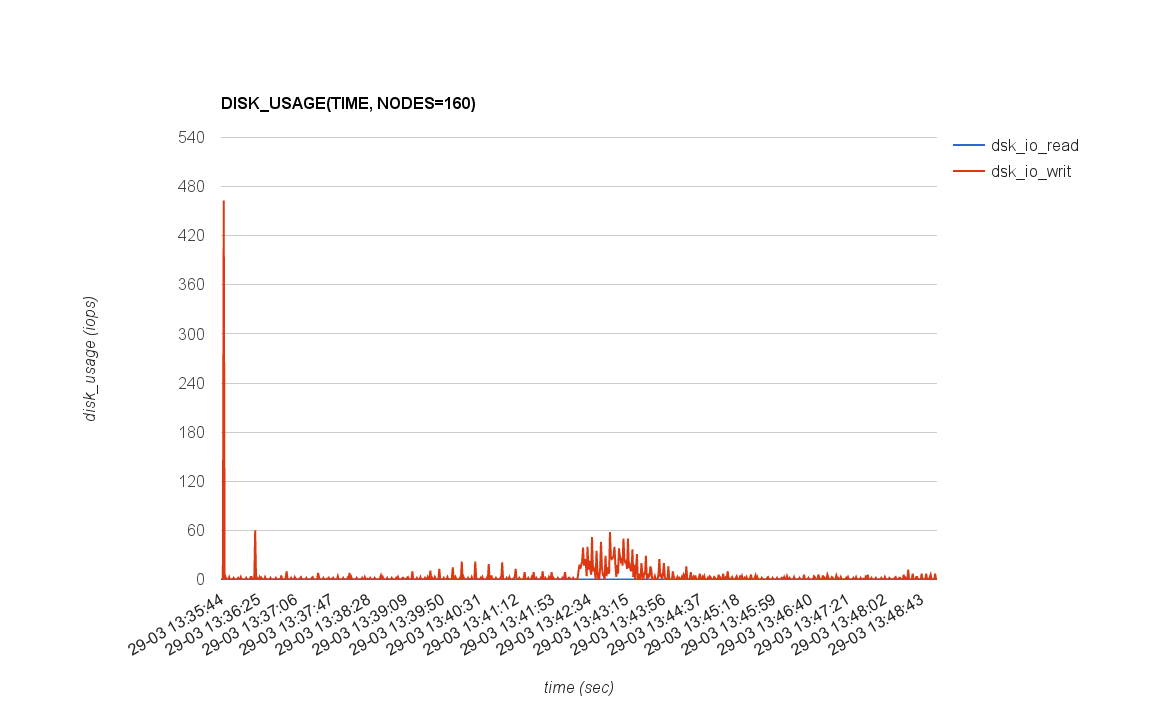
Case when pxlinux downloads kernel via TFTP
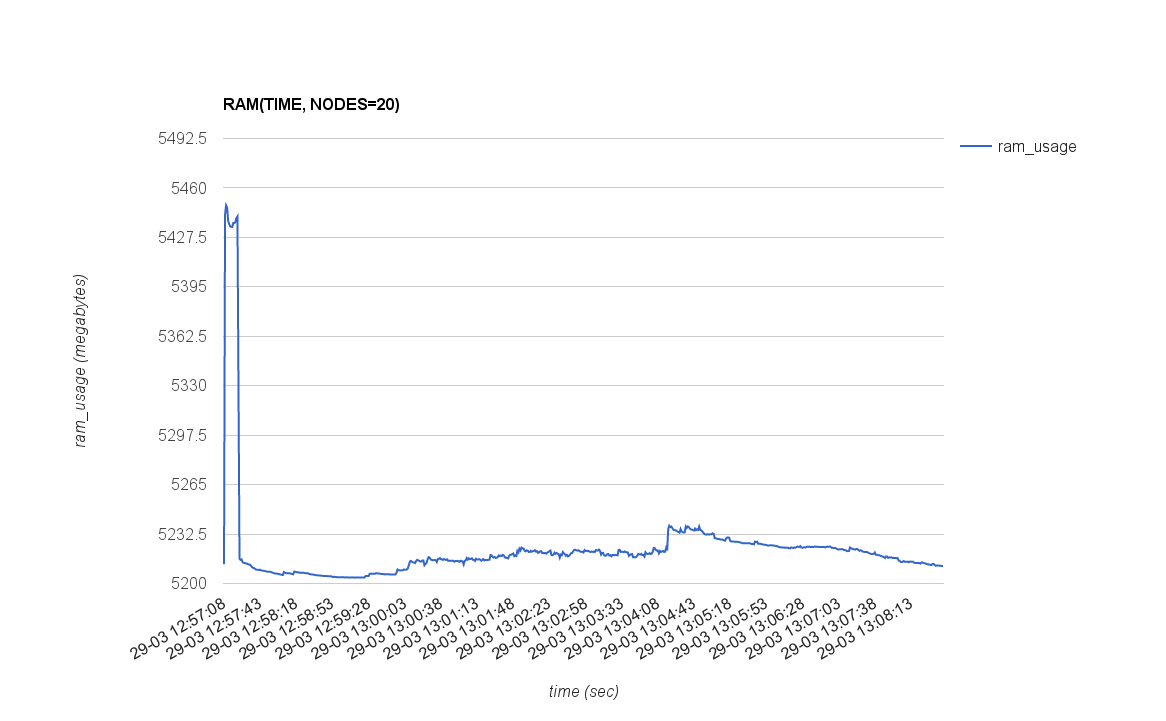
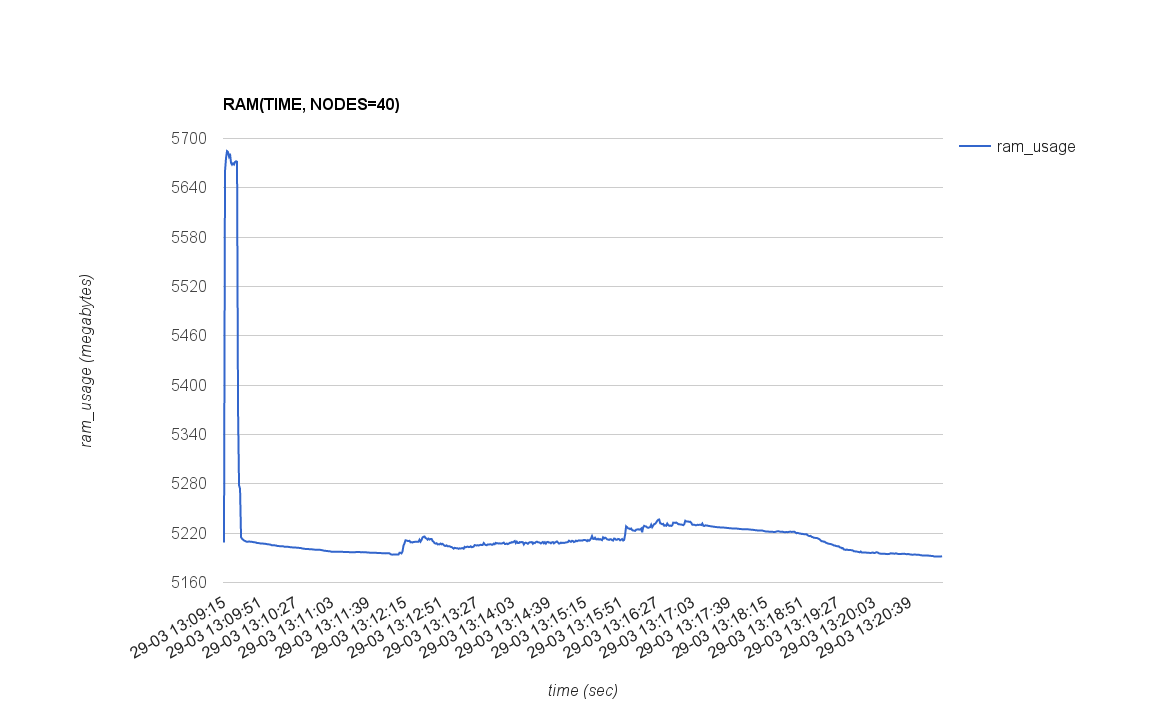
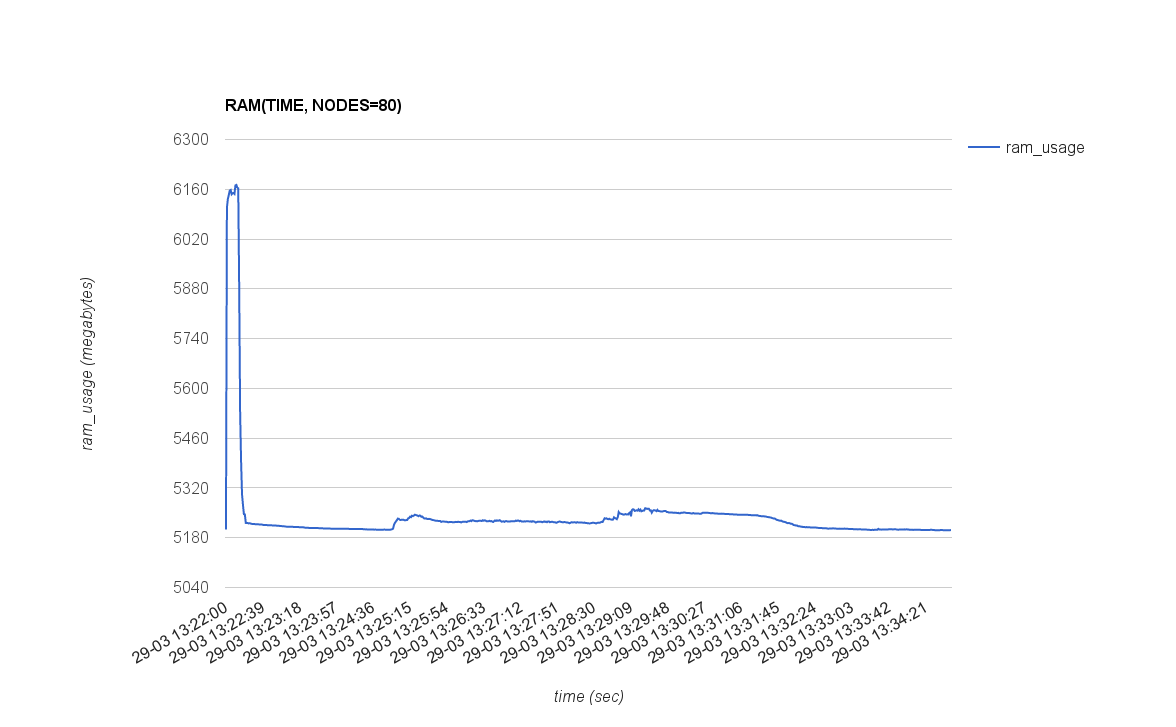
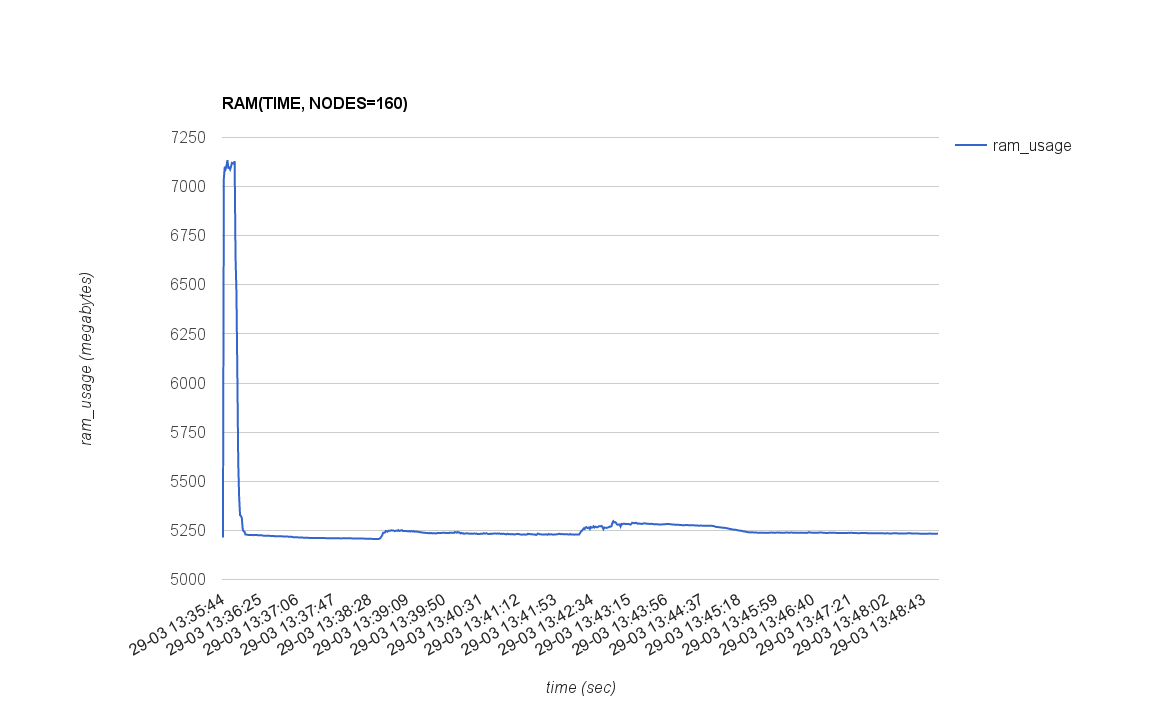
After simple processing results the following plots for performance metrics collected during provisioning of the nodes in depend on time created (click to expand an image):
CPU(TIME), RAM(TIME)
| Number of nodes | Plot CPU(TIME) | Plot RAM(TIME) |
|---|---|---|
| 1 | 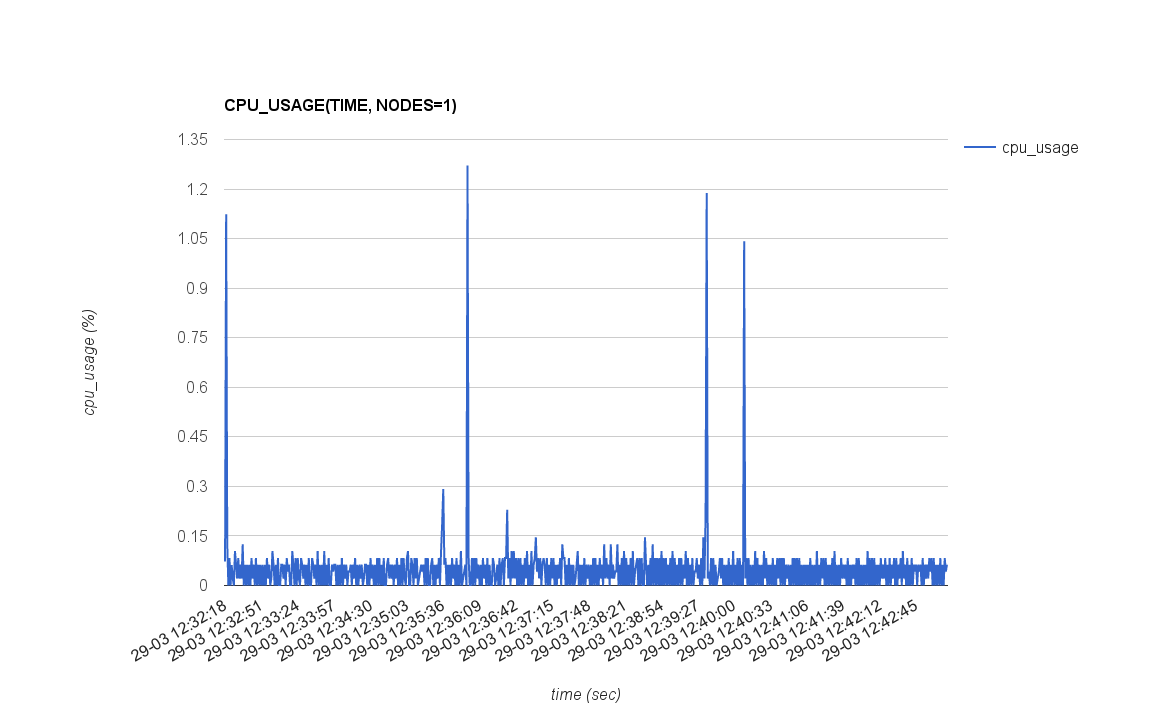 |
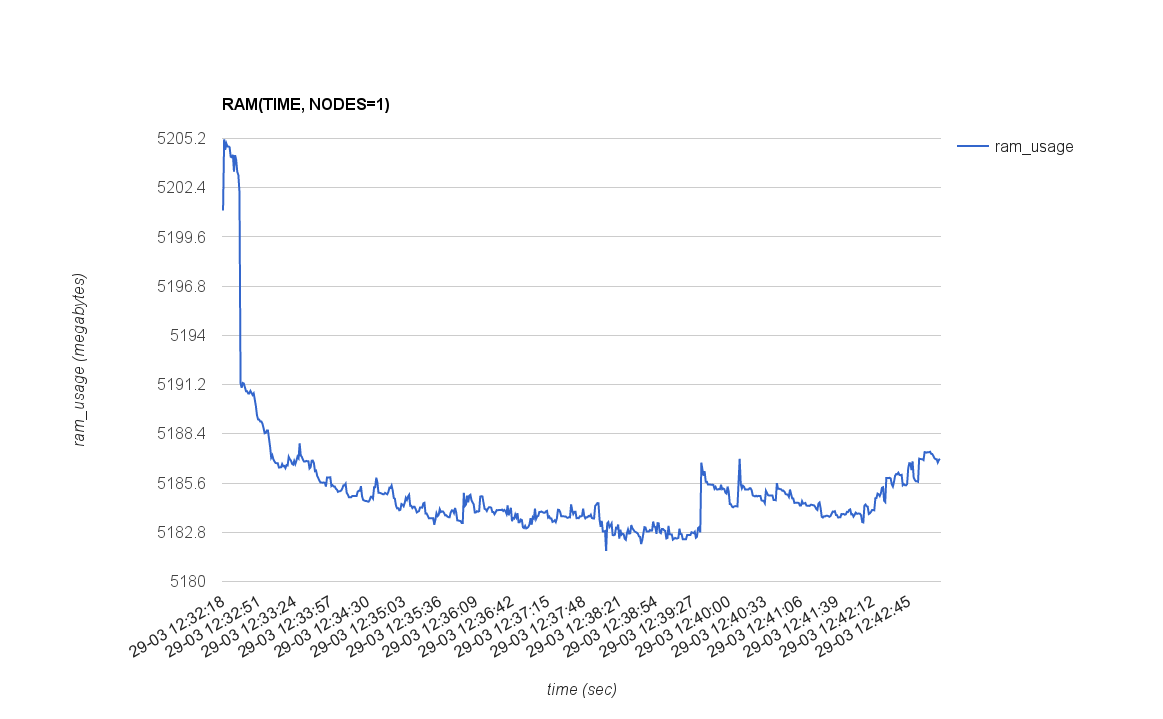 |
| 10 | 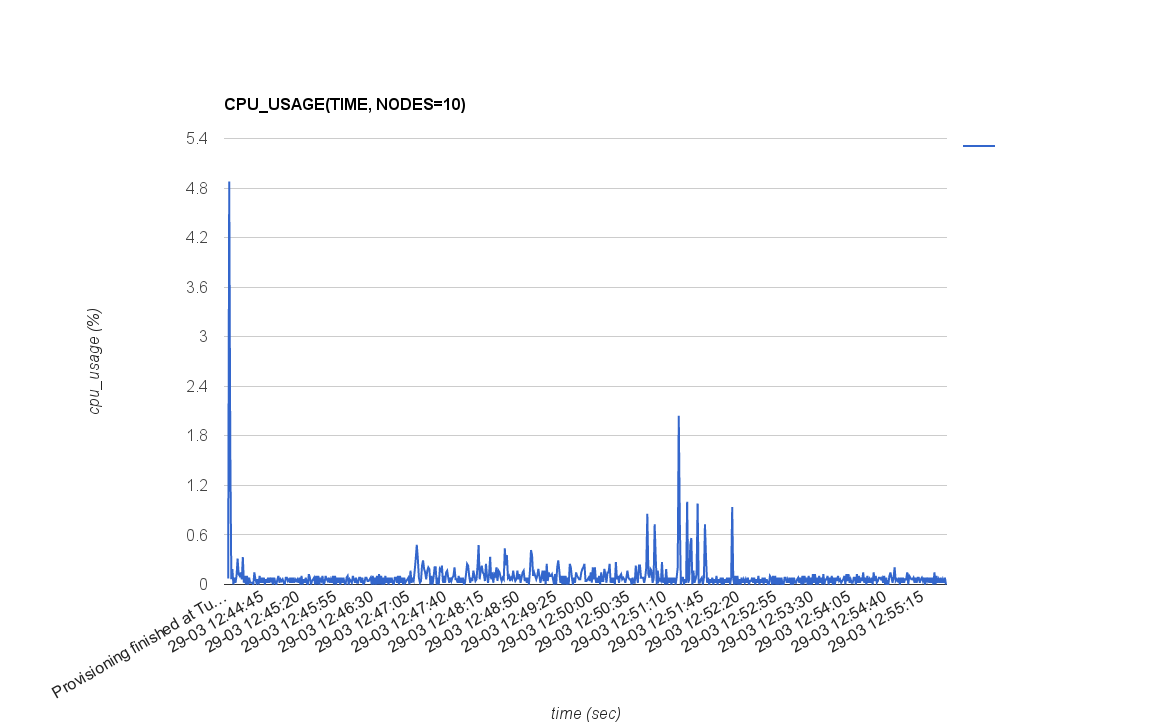 |
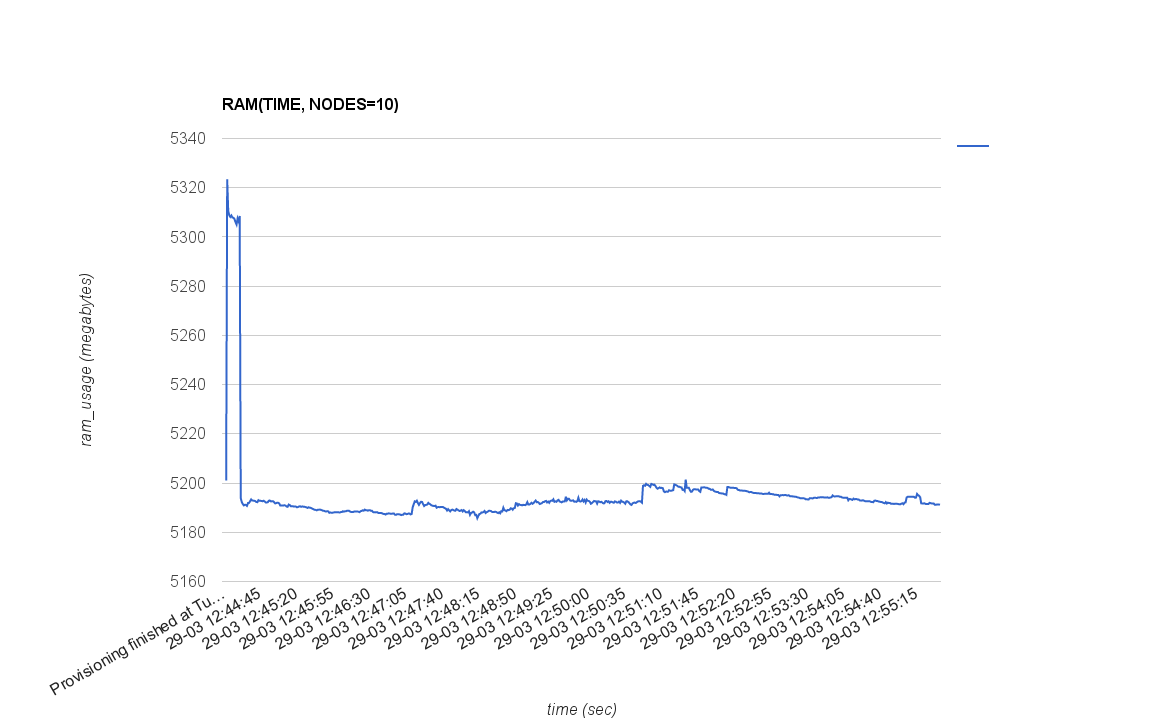 |
| 20 | 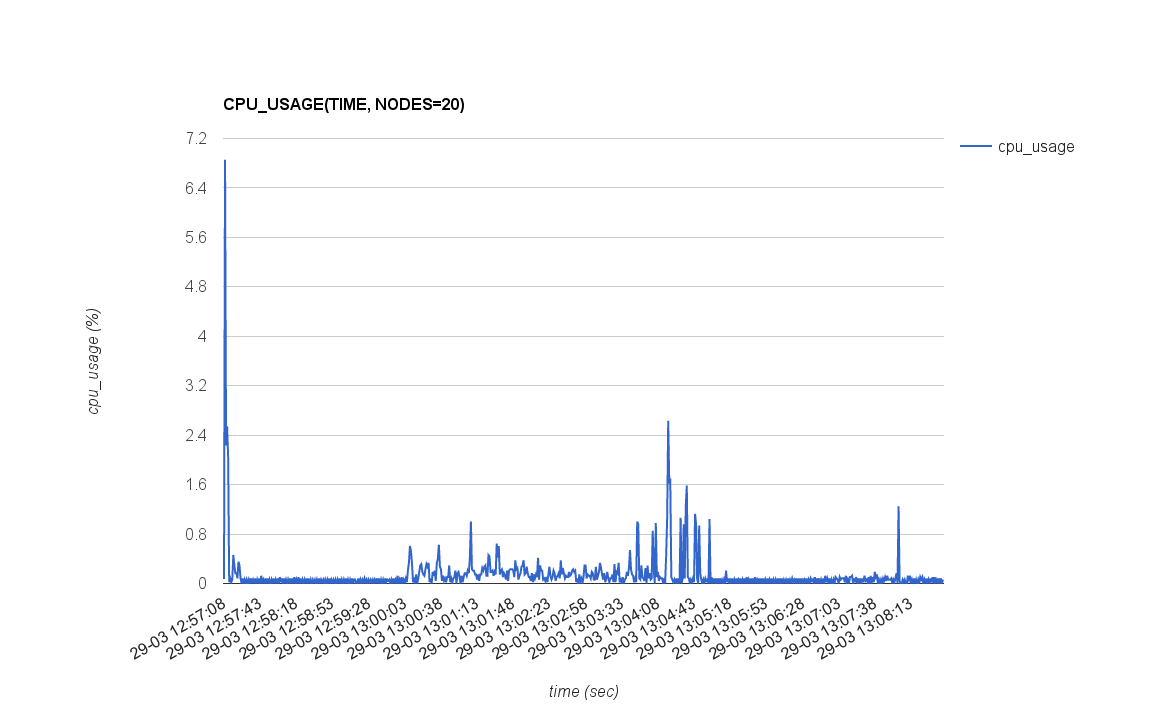 |
 |
| 40 | 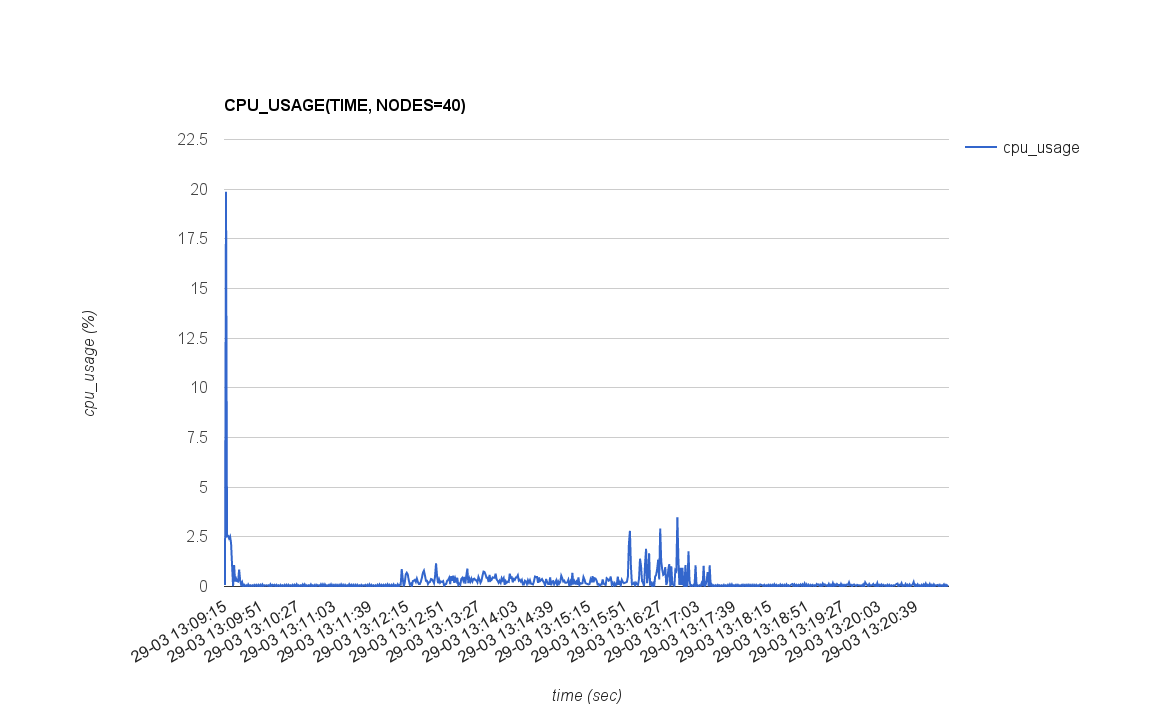 |
 |
| 80 | 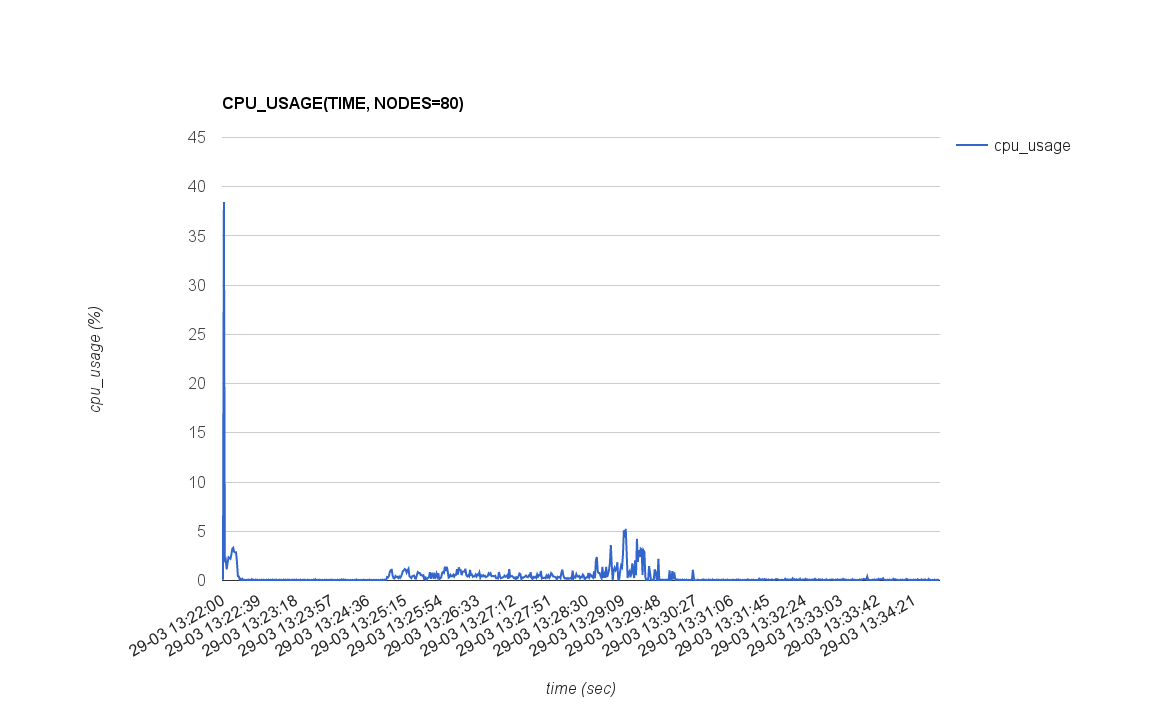 |
 |
| 160 | 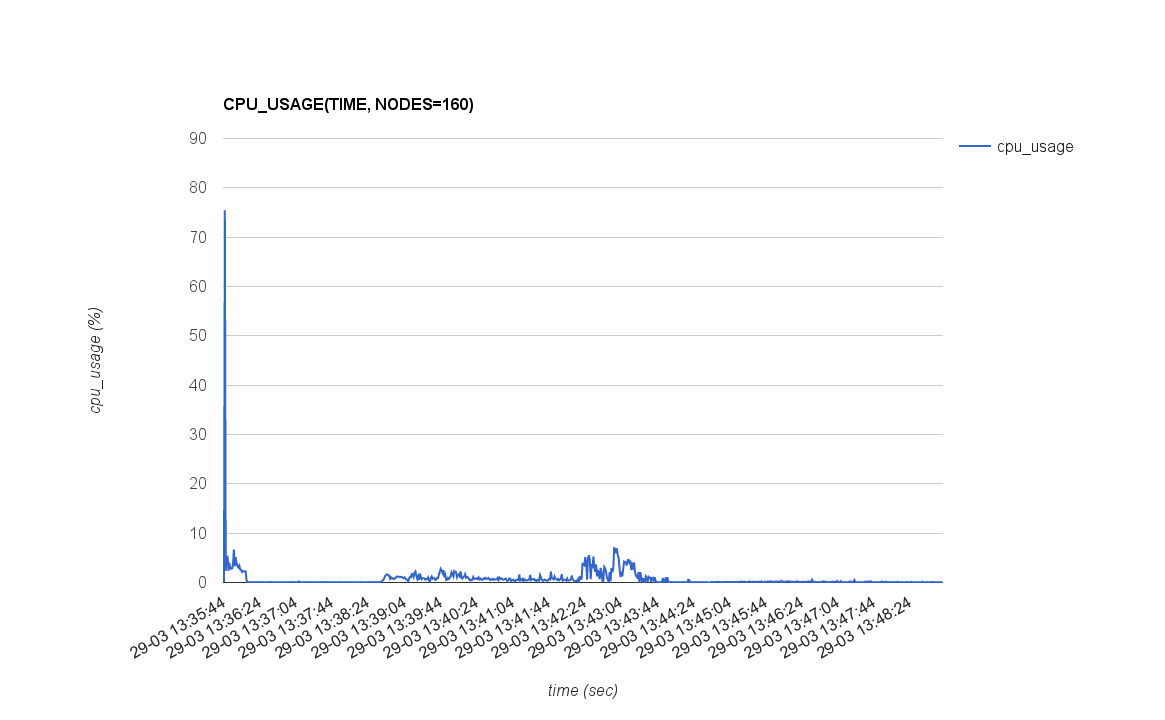 |
 |
| 195 | 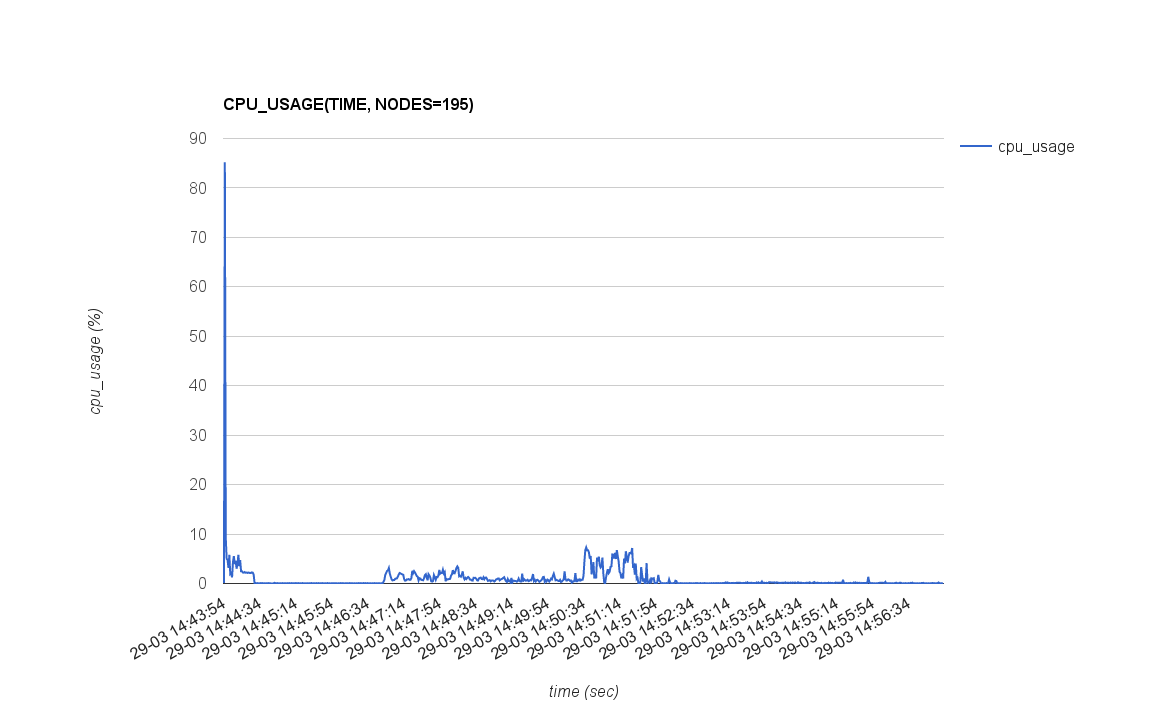 |
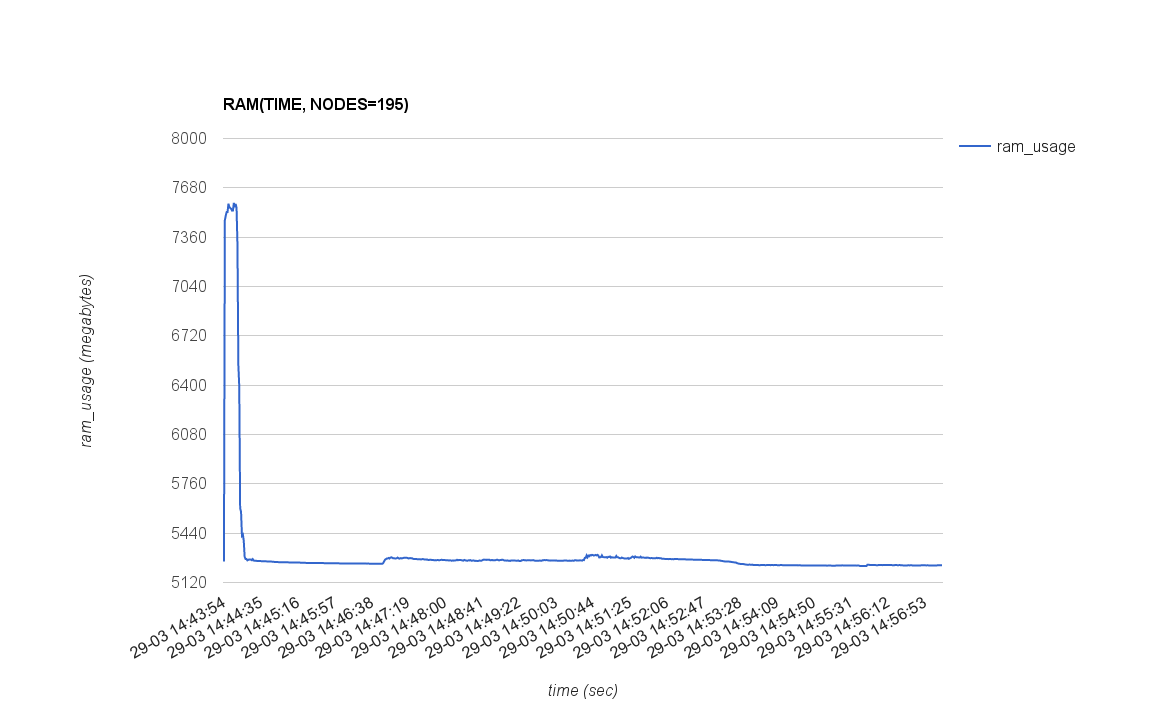 |
NET(TIME), DISK(TIME)
| Number of nodes | Plot NET(TIME) | Plot DISK(TIME) |
|---|---|---|
| 1 | 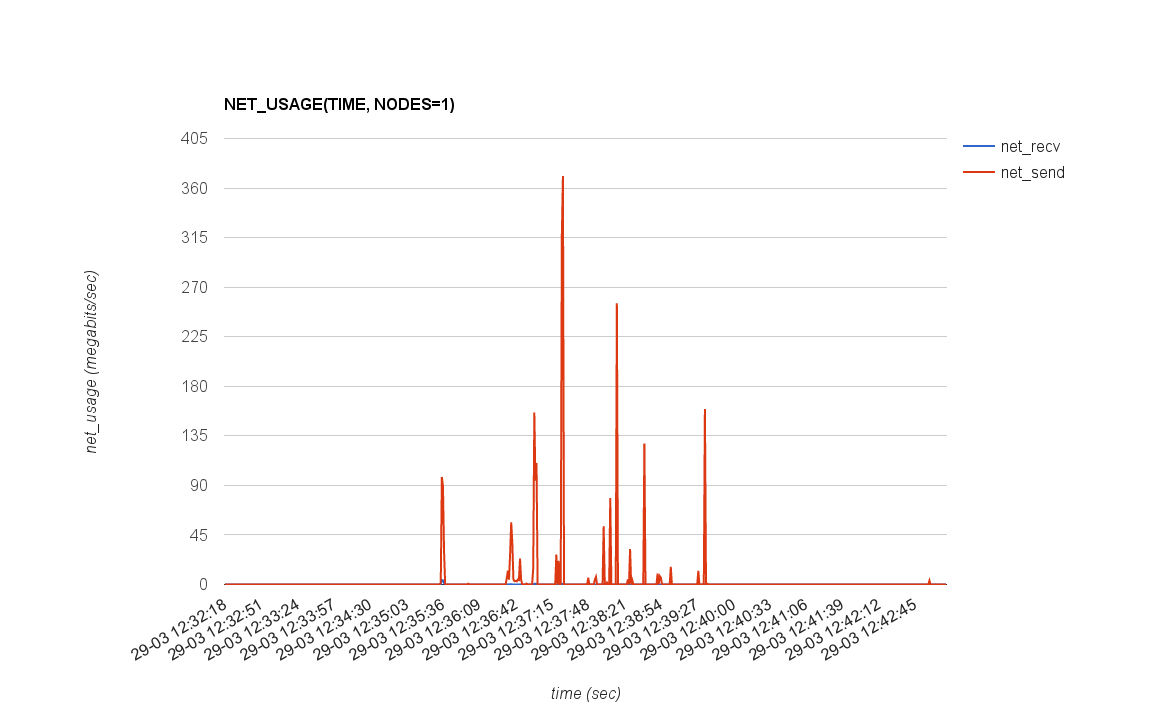 |
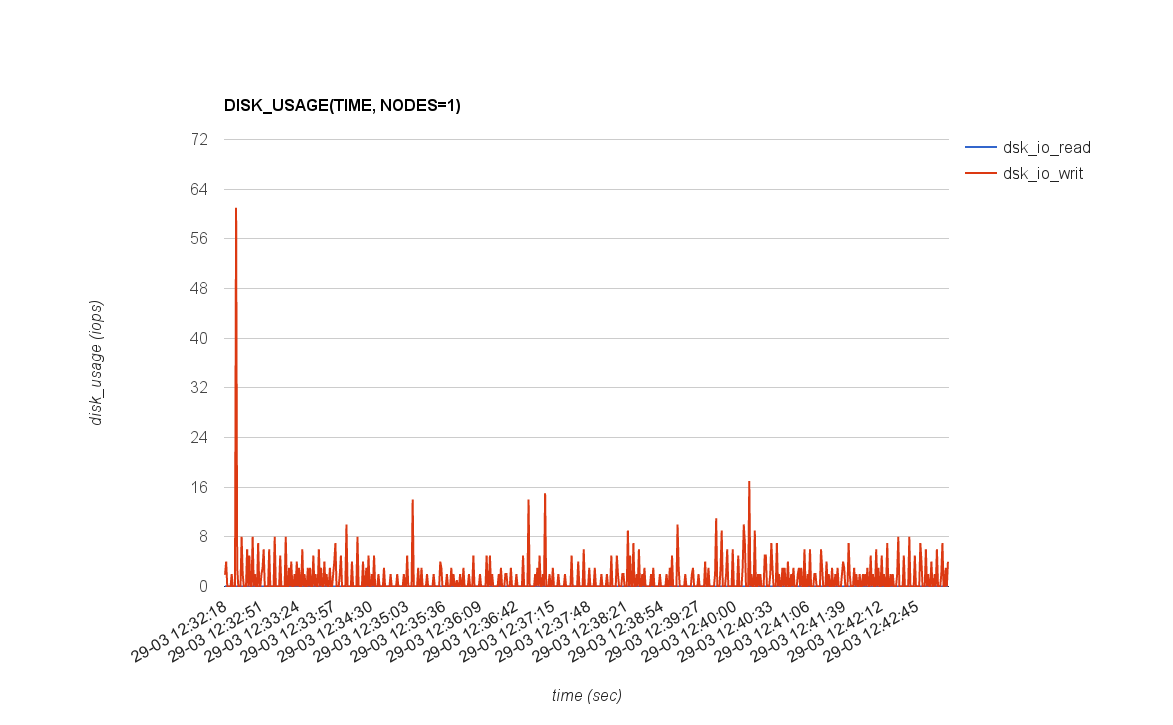 |
| 10 | 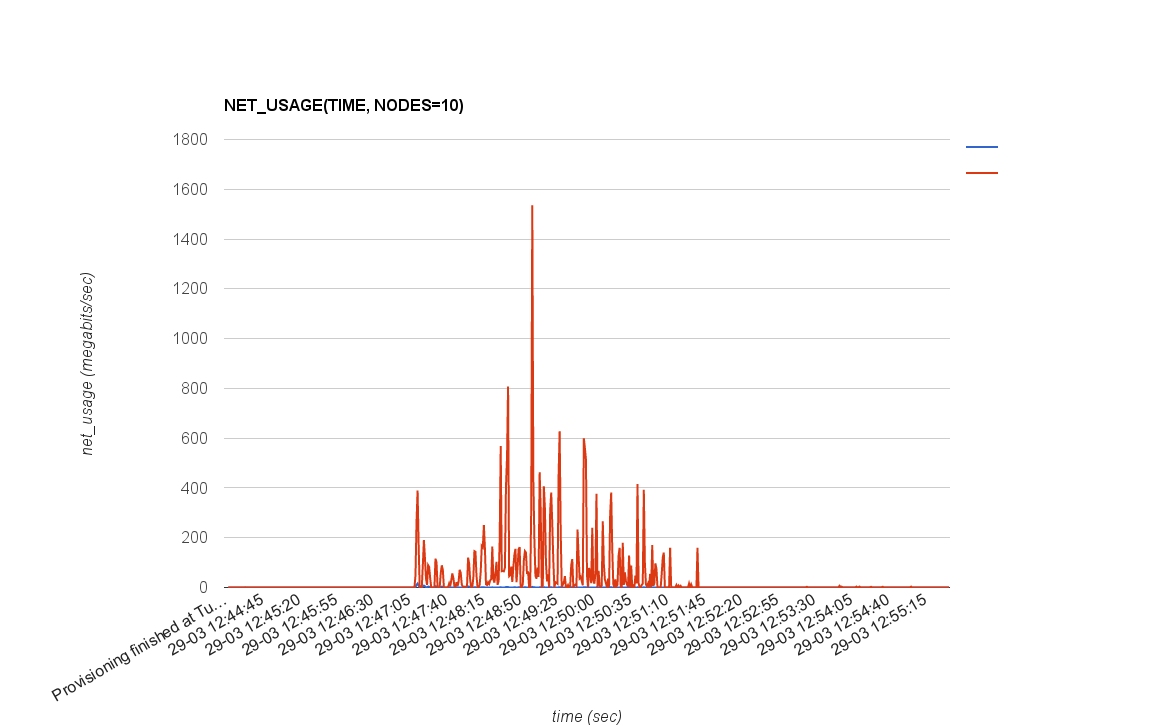 |
 |
| 20 | 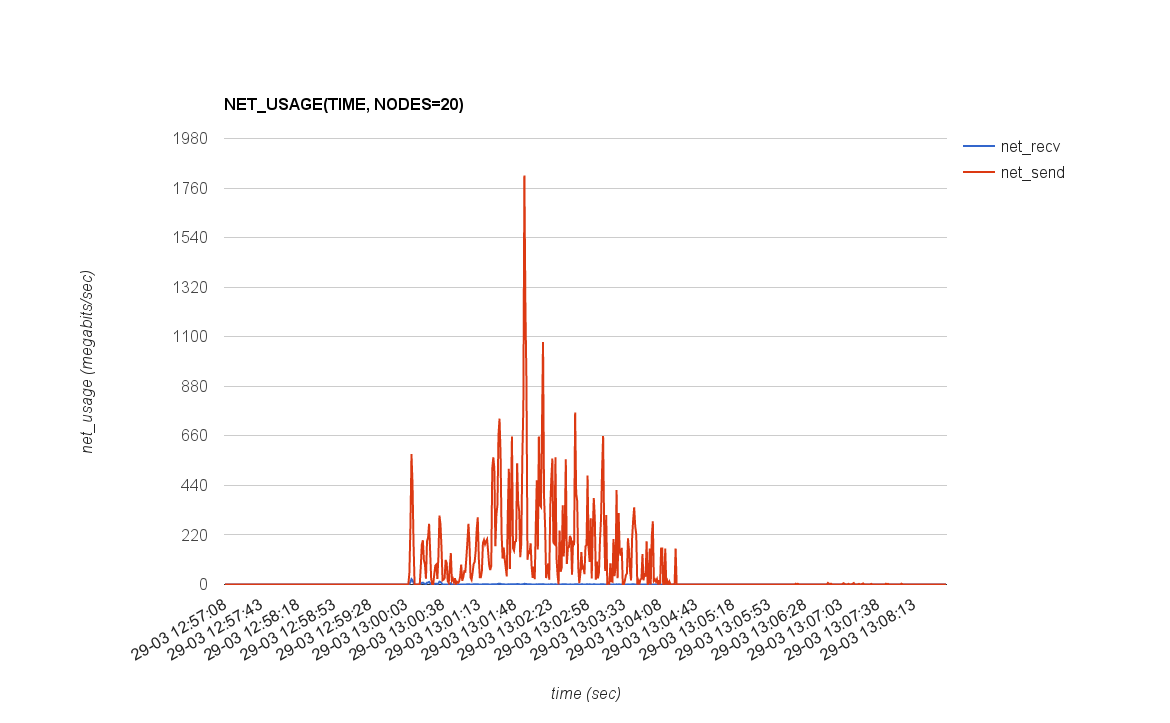 |
 |
| 40 | 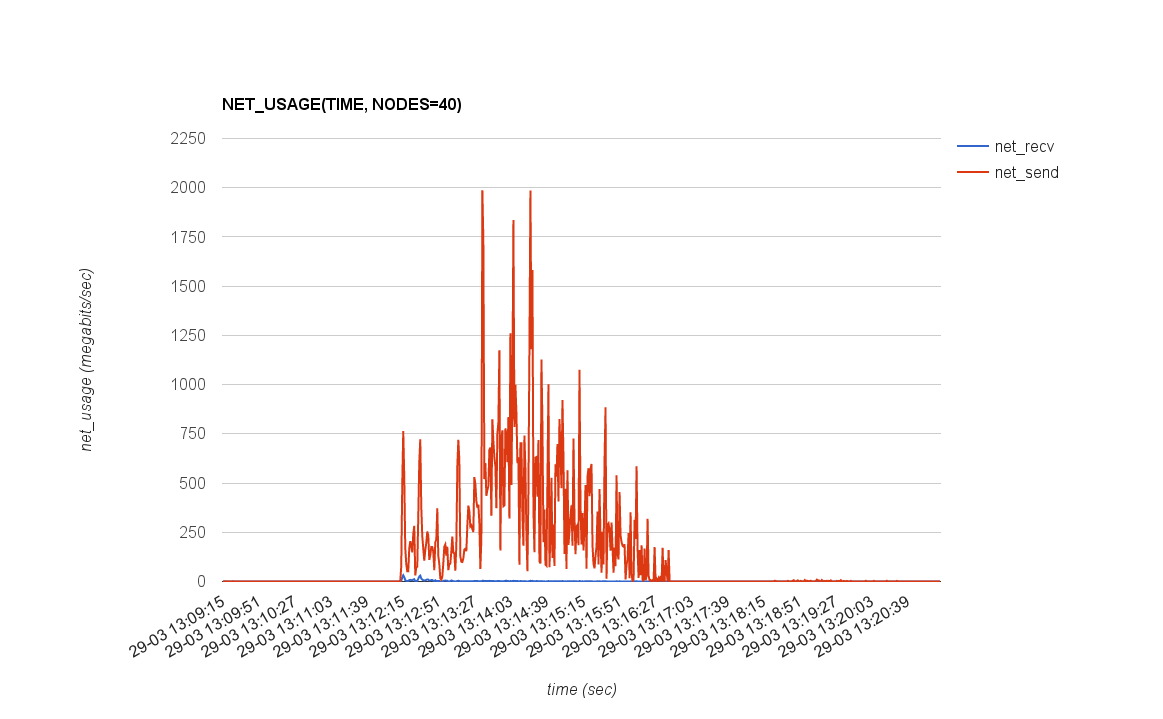 |
 |
| 80 | 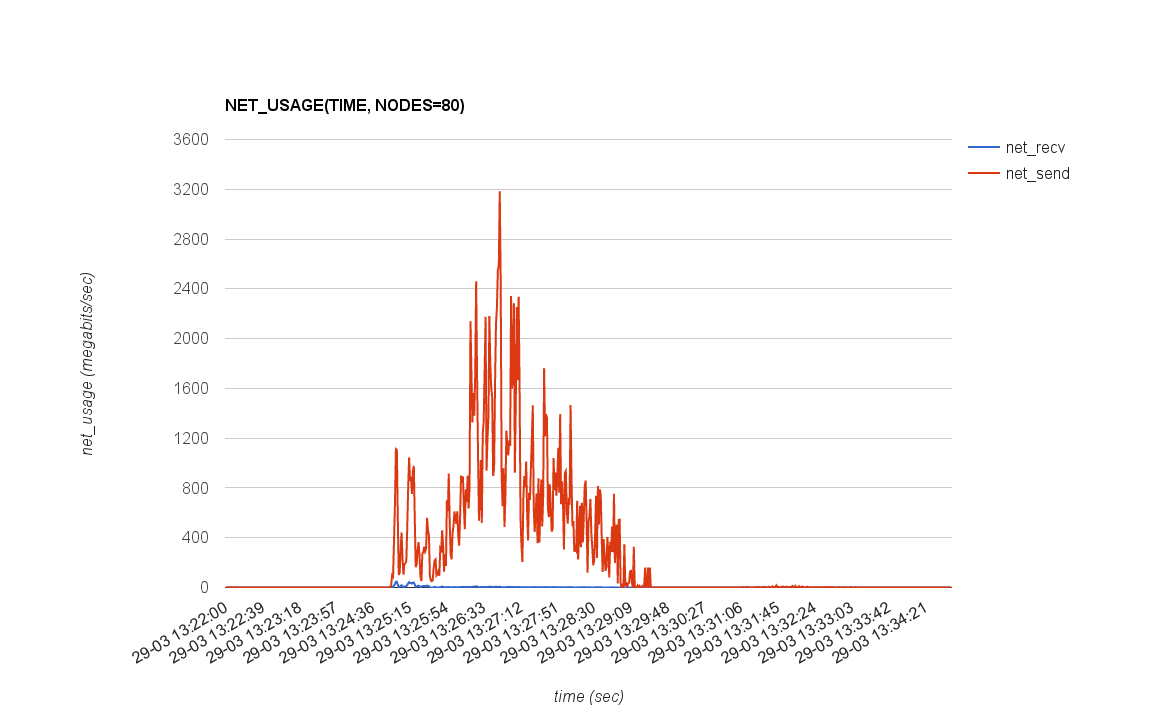 |
 |
| 160 | 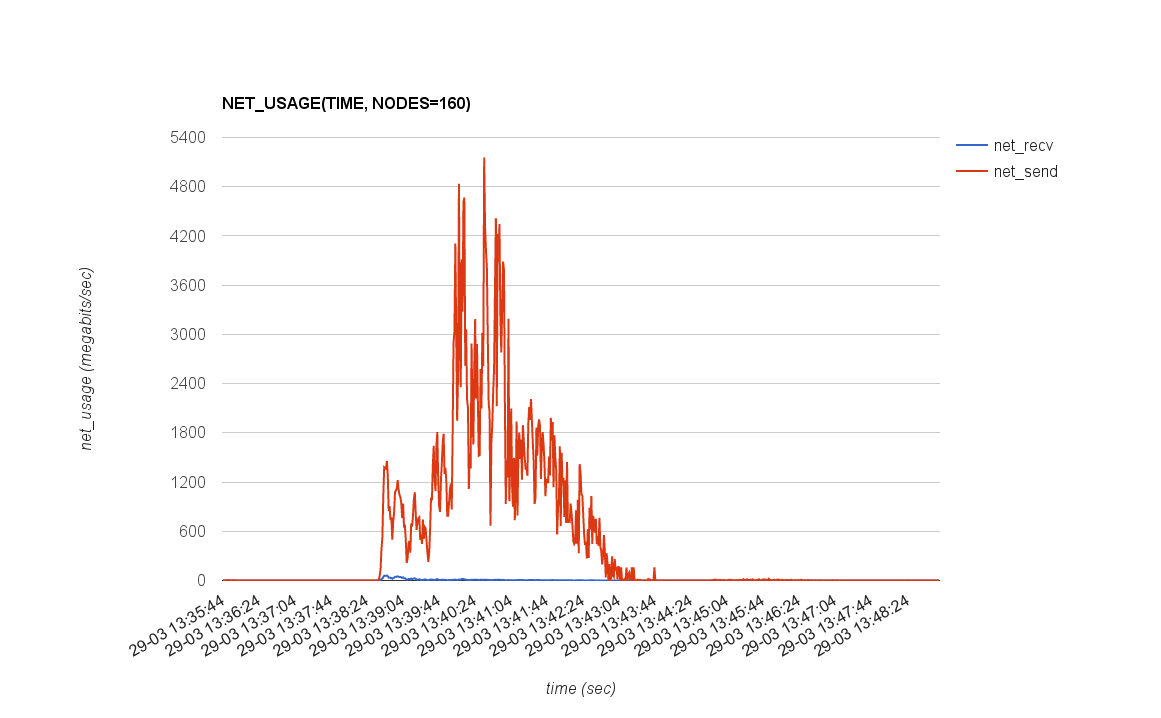 |
 |
| 195 |  |
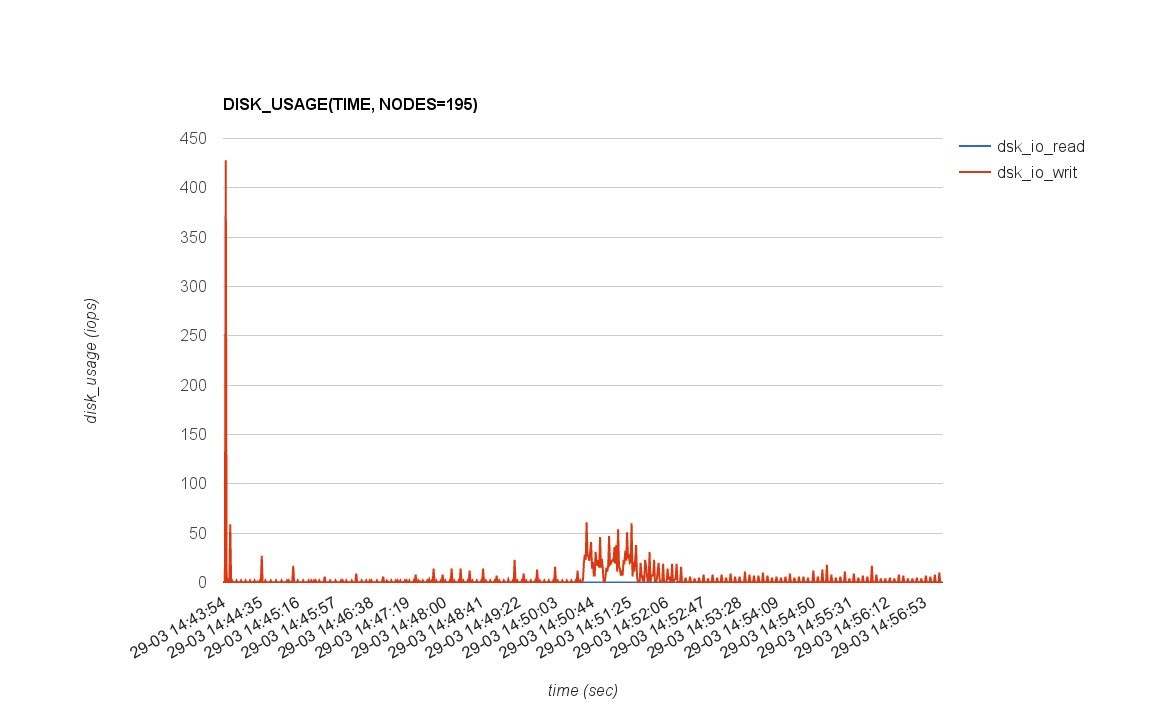 |
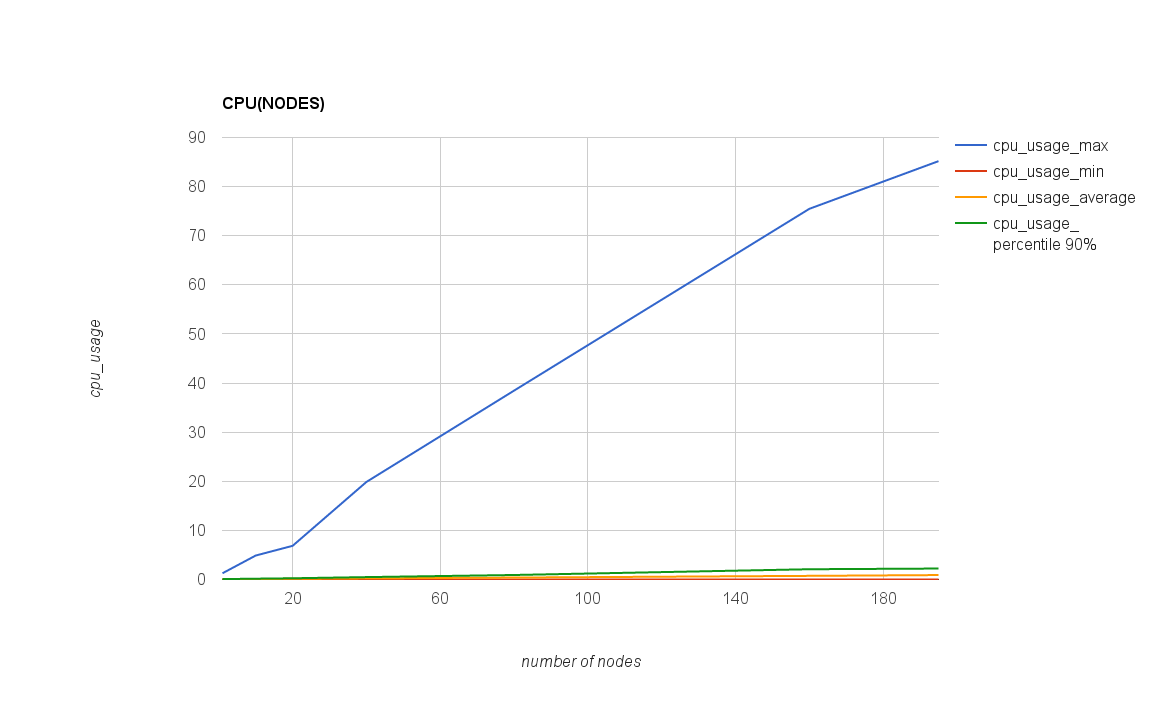
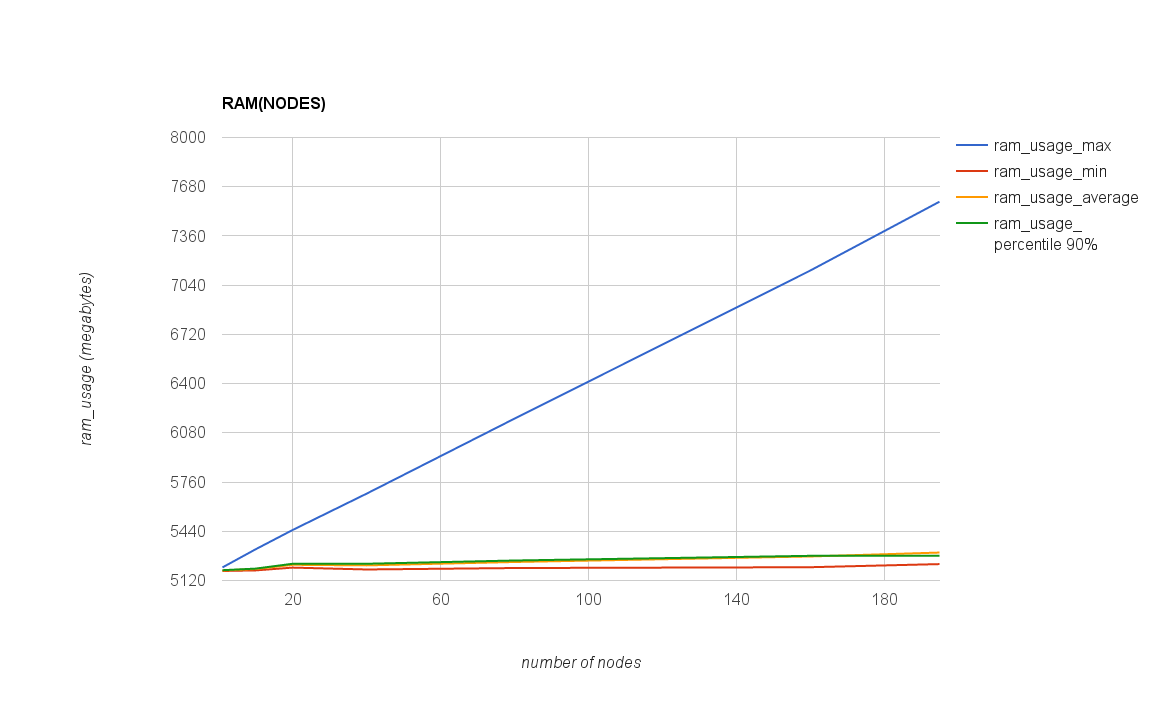
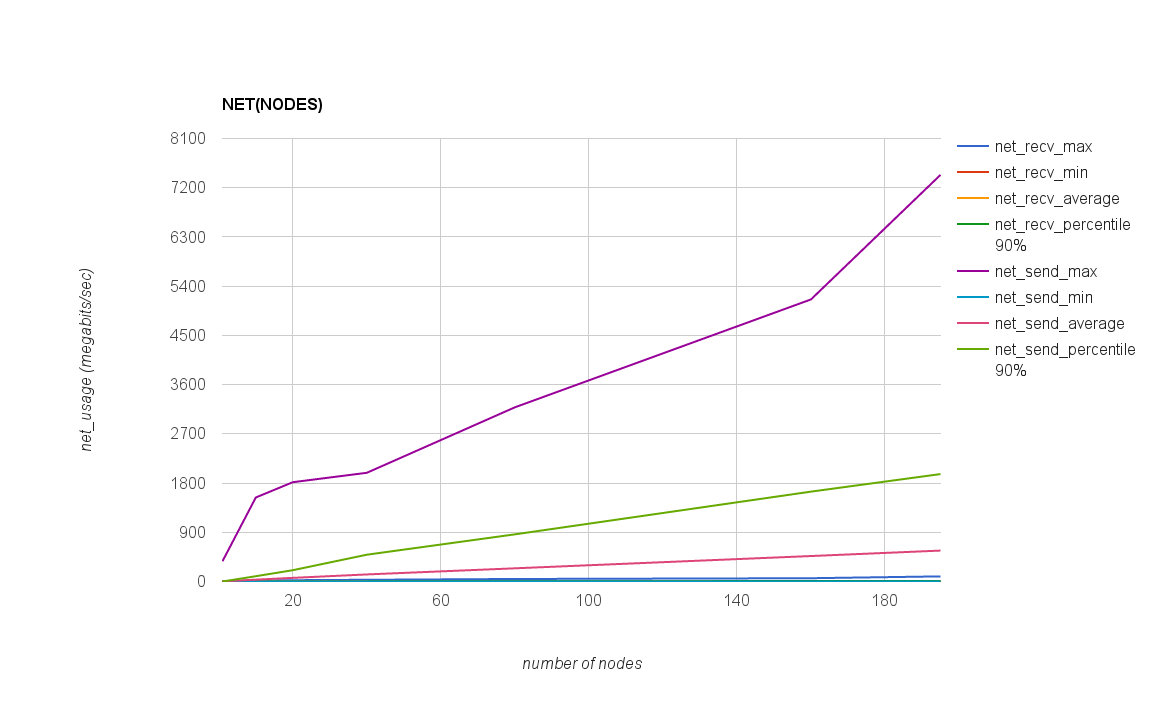
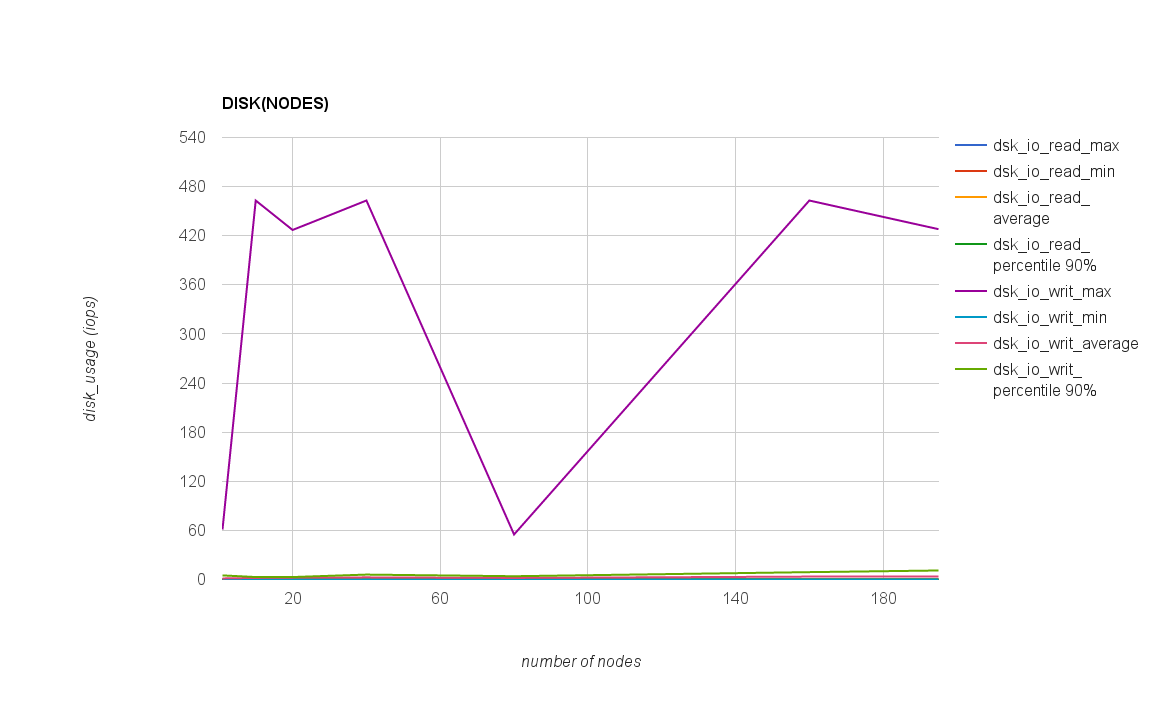
The following table and graphs show how performance metrics and provisioning time parameters depend on numbers of nodes.
| numbers of nodes | 1 | 10 | 20 | 40 | 80 | 160 | 195 |
|---|---|---|---|---|---|---|---|
| provisioning time | 655.309167699 | 685.366625243 | 697.005017299 | 716.179839426 | 768.240187372 | 795.676431454 | 798.103271441 |
| cpu_usage_max | 1.271 | 4.88 | 6.857 | 19.866 | 38.46 | 75.475 | 85.182 |
| cpu_usage_min | 0 | 0 | 0 | 0 | 0 | 0 | 0 |
| cpu_usage_average | 0.04915091463 | 0.09638921283 | 0.1376284075 | 0.2399679219 | 0.3951248375 | 0.7407713568 | 0.9038723404 |
| cpu_usage_percentile 90% | 0.083 | 0.167 | 0.25 | 0.488 | 0.9172 | 2.0905 | 2.2302 |
| ram_usage_max | 5205.15 | 5323.44 | 5448.61 | 5684.64 | 6172.27 | 7134.59 | 7582.7 |
| ram_usage_min | 5181.74 | 5185.72 | 5203.85 | 5191.63 | 5201.07 | 5206.32 | 5226.64 |
| ram_usage_average | 5185.197835 | 5194.588353 | 5222.031549 | 5218.299512 | 5240.278635 | 5276.185992 | 5301.640676 |
| ram_usage_percentile 90% | 5186.965 | 5197.37 | 5228.904 | 5228.812 | 5249.982 | 5280.4 | 5280.912 |
| net_recv_max | 4.03802 | 16.0916 | 23.9195 | 31.5682 | 45.9824 | 60.1388 | 93.5101 |
| net_recv_min | 0 | 0 | 0 | 0 | 0 | 0 | 0 |
| net_recv_average | 0.02883827959 | 0.2355115738 | 0.4605028878 | 0.8857573161 | 1.643228416 | 3.174715098 | 3.858486644 |
| net_recv_percentile 90% | 0.01241305 | 0.4111175 | 0.9639786 | 2.218254 | 3.943012 | 8.279855 | 9.897108 |
| net_send_max | 370.962 | 1535.99 | 1815.63 | 1987.61 | 3184.7 | 5157.32 | 7434.88 |
| net_send_min | 0 | 0 | 0 | 0 | 0 | 0 | 0 |
| net_send_average | 3.53548533 | 33.7695734 | 66.46850655 | 129.2245215 | 240.9720221 | 465.5923141 | 565.352486 |
| net_send_percentile 90% | 0.01602555 | 96.58555 | 206.7048 | 489.8658 | 862.1248 | 1643.095 | 1964.3 |
| dsk_io_read_max | 0.072 | 0.072 | 0.072 | 0.072 | 1 | 0.071 | 0.07 |
| dsk_io_read_min | 0 | 0 | 0 | 0 | 0 | 0 | 0 |
| dsk_io_read_average | 0.0001097560976 | 0.0001049562682 | 0.0001032998565 | 0.00010041841 | 0.001394018205 | 0.0000891959799 | 0.00008760951189 |
| dsk_io_read_percentile 90% | 0 | 0 | 0 | 0 | 0 | 0 | 0 |
| dsk_io_writ_max | 61 | 463 | 427 | 463 | 55 | 463 | 428 |
| dsk_io_writ_min | 0 | 0 | 0 | 0 | 0 | 0 | 0 |
| dsk_io_writ_average | 1.321489329 | 1.940080175 | 2.288228121 | 2.612129707 | 1.923149545 | 3.551388191 | 3.694494368 |
| dsk_io_writ_percentile 90% | 5 | 3 | 3 | 6 | 4 | 9 | 11 |
PROVISIONING_TIME(NODES)
CPU(NODES), RAM(NODES) ^^^^^^^^^^^^^^^^^^^^
| Plot CPU(NODES) | Plot RAM(NODES) |
|---|---|
 |
 |
NET(NODES), DISK(NODES)
| Plot NET(NODES) | Plot DISK(NODES) |
|---|---|
 |
 |
Issues which have been found during the tests
Linux kernel can't be downloaded by pxelinux via HTTP
During testing the case when pxelinux downloads kernel via HTTP, we have found that during provisioning numbers of nodes more then 20 some servers (2 for case when we tries to provision 40 nodes and up to 7 when tries to provision 195 nodes) can be stacked on the downloading of ubuntu installer kernel. Here is example of screen:
In Apache log files we can see the following lines
10.50.11.2 - - [29/Mar/2016:11:57:34 +0000] 300100342 "GET /cblr//images/ubuntu14-x86_64/linux HTTP/1.0" 200 102200 "-" "Syslinux/6.03"It means that transferred data (linux file) is too small (102200 bytes). Actually the size of the linux kernel was 5778968 bytes. Apache return 200 code after "Timeout" parameter which specified in its configuration file.
Applications
Installation script and config files
installing/install_cobbler.sh
Here you can find the configs for the script:
configs/etc/cobbler/settings:
installing/configs/etc/cobbler/settings
configs/etc/cobbler/dhcp.template:
installing/configs/etc/cobbler/dhcp.template
configs/etc/cobbler/pxe/pxesystem.template:
installing/configs/etc/cobbler/pxe/pxesystem.template
configs/etc/cobbler/pxe/pxelocal.template:
installing/configs/etc/cobbler/pxe/pxelocal.template
configs/var/lib/cobbler/kickstarts/sample.seed:
installing/configs/var/lib/cobbler/kickstarts/sample.seed
Script to start provisioning and collect metrics
measure.sh
Script to add cobbler systems
add_cobbler_systems.sh


