Maintain format of the document.

Implements: blueprint maintain-document
Change-Id: I3f22448c53c827a7402af3a514112e63196cdf3b
1.7 KiB
1.7 KiB
Configure Profiler
Overview
osprofiler, the Cross-project profiling library for OpenStack, is integrated in Vitrage to generate 1 trace per request, that goes through all involved services.
Configuration
Profiling must be enabled explicitly in Vitrage configuration file:
[profiler]

enabled = true
hmac_keys = SECRET_KEY
connection_string = redis://<ip-address>:6379/hmac_keywill be used in client to sign a request with profiling enabledconnection_stringspecify the storage driver to collect tracing data, fill in real IP address of redis here.
Note: in devstack environment, redis is available on
redis://127.0.0.1:6379.
Please refer to osprofiler user manual for details.
Usage
Use --profile option in Vitrage CLI to send a request
with profiling enabled, e.g.:
vitrage --profile SECRET_KEY topology showThe key must match the hmac_keys configured in the server.
The uuid of trace will be prompted in console after the normal result. For example:
{
"directed": true,
"graph": {},
"nodes": [],
"links": [],
"multigraph": true
}
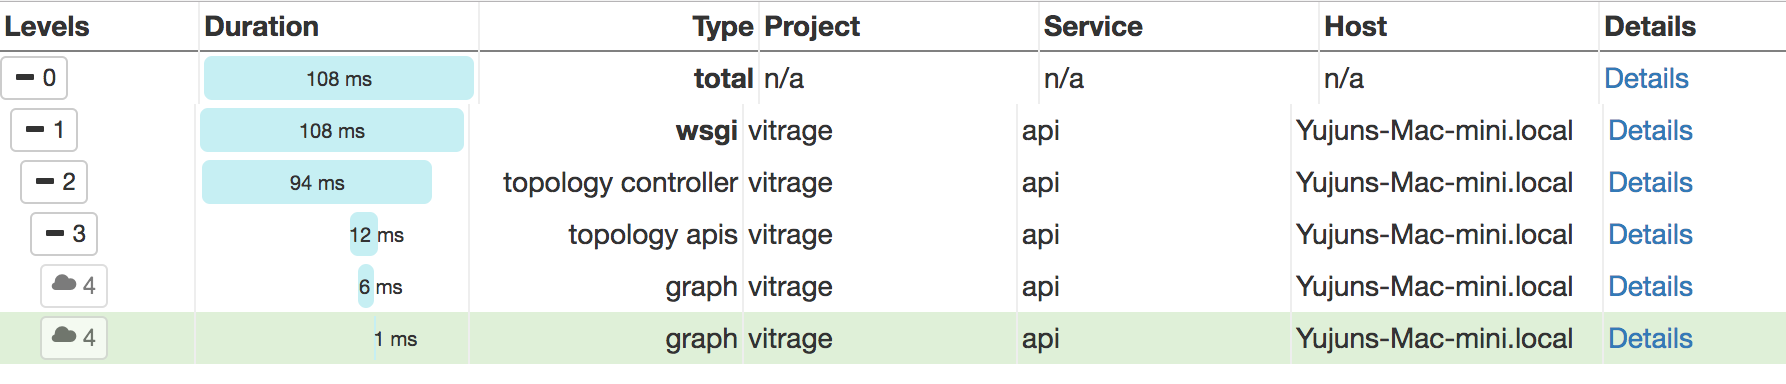
To display trace use the command:
osprofiler trace show --html 8c2a594b-bb26-4a00-a408-fd378ae3566bFollow the help message above to show the trace file with
osprofiler client:
osprofiler trace show --html <TRACE-ID> --connection-string=redis://<ip-address>:6379